Is This Time Different? 35 Years of European Expectations about Technology and Jobs
Abstract
Fears that automation destroys more jobs than it creates have resurfaced with artificial intelligence. Using five Eurobarometer waves (1989–2024) covering 12 European countries, I examine the long-run evolution of perceptions of technological unemployment. Contemporary pessimism is not historically unusual, it was substantially higher in 1989, and especially 1992, than in 2024. Social divides have also changed. Pronounced educational and occupational differences in 1989 had largely disappeared by 2024. An Oaxaca–Blinder decomposition shows that changing population composition explains little of the decline. These findings show that both the level and the socioeconomic and national patterning of concerns about technological unemployment have changed substantially over time.
Keywords
Artificial Intelligence, Attitudes, employment
Introduction
New technologies have often prompted fears of a “job apocalypse”, the concern that automation will destroy jobs and ultimately lead to mass unemployment (Mokyr, Vickers, and Ziebarth (2015)). Artificial intelligence (AI) is no exception. Recent media coverage reflects the persistence of these anxieties. A Guardian article (Greenhouse (2025)), for example, is titled, “Most people aren’t fretting about an AI bubble. What they fear is mass layoffs” while CNBC (Lange and Alper (2025)) reports that “Americans fear AI permanently displacing workers, Reuters/Ipsos poll finds”.
While current media coverage typically focuses on recent survey evidence, in this paper, I place current concerns in a long-run perspective by analyzing five waves of Eurobarometer surveys conducted between 1989 and 2024. Across these waves, respondents in 12 European countries were asked whether they agreed with the statement that automation would create more jobs than it would eliminate. A long-run perspective is important because attitudes observed today are difficult to interpret without a historical benchmark: seemingly exceptional concerns about AI and automation may instead reflect recurring anxieties about technological change.
The lack of comparable historical opinion surveys has also shaped the academic literature. Studies of earlier periods have largely relied on indirect evidence of attitudes toward technological change, such as the views of prominent individuals (Mokyr, Vickers, and Ziebarth (2015)) or episodes of collective resistance to labor-saving technologies (Caprettini and Voth (2020)). More recent studies, by contrast, use contemporaneous survey data to examine public perceptions of automation and technological change directly (Dekker, Salomons, and Waal (2017), Shoss and Ciarlante (2022), Włoch, Śledziewska, and Rożynek (2025), Arntz, Blesse, and Doerrenberg (2026)).
Understanding these perceptions matters because beliefs about the labor-market consequences of new technologies can themselves have economic and political consequences. Shiller (2026) argues that fears of AI-induced job losses may weaken consumer sentiment, potentially making pessimistic expectations partly self-fulfilling. Perceptions of technological unemployment may also shape public support for the development and regulation of AI. Wu et al. (2026) argue that perceptions of AI-related unemployment risk can influence support for policies that either encourage or constrain AI development. Similarly, Lee (2024) and Haslberger, Gingrich, and Bhatia (2025) emphasize the importance of sociotropic concerns: individuals’ policy preferences depend not only on how they expect AI to affect their own jobs, but also on how they expect it to affect the employment prospects of others.
This paper complements this literature by shifting the focus from explaining attitudes at a single point in time to examining how perceptions of technological unemployment evolve over the long run. The repeated Eurobarometer questions provide a rare opportunity to compare attitudes toward the employment consequences of automation over a 35-year period using closely comparable survey questions. This makes it possible not only to assess whether contemporary concerns are historically unusual, but also to examine whether the demographic, socioeconomic, and political correlates of these concerns are stable over time. In addition to documenting aggregate trends, I examine differences by country, age, gender, education, political orientation, and occupation, and use an Oaxaca–Blinder decomposition to distinguish changes associated with shifts in population composition from changes in the relationships between these characteristics and perceptions of automation. Finally, I compare attitudes toward automation and employment with broader attitudes toward science and technology. This allows me to examine whether periods of heightened concern about technological unemployment simply reflect more general technological pessimism or instead represent distinct concerns about the labor-market consequences of technological change.
The results reveal four main patterns. First, contemporary concern about technological unemployment is not historically exceptional. Although a substantial share of Europeans remain pessimistic about the employment effects of AI and automation, disagreement with the proposition that automation creates more jobs than it eliminates was considerably higher in 1989 and especially in 1992 than in late 2024. Second, the social correlates of these attitudes are not stable over time. Several differences that were pronounced in 1989, most notably those associated with education and manual versus non-manual employment, had largely disappeared by 2024. An Oaxaca–Blinder decomposition shows that changes in the observable composition of the population explain only a relatively small share of the long-run decline in pessimism; most of the decline is associated with changes in the relationships between respondent characteristics and attitudes and with factors not captured by the model. Third, national patterns have also changed substantially. Rather than countries maintaining stable relative positions, the cross-country distribution of pessimism has been significantly reshuffled over time. Fourth, The exceptionally high level of pessimism about automation and employment in 1992 was not accompanied by unusually negative attitudes toward science and technology more generally. Similarly, between 2021 and 2024, concern that science and technology were changing people’s way of life too quickly increased substantially, while perceptions of the employment consequences of automation changed relatively little. Concerns about technological unemployment therefore appear to be distinct from more general optimism or anxiety about technological change.
The remainder of the paper is structured as follows. I first summarize the existing literature about expectations about macro-level employment. I then describe the Eurobarometer survey data and the construction of the main variables. This is followed by an examination of how perceptions of the employment consequences of automation have evolved over time, both in the aggregate and across countries and socioeconomic and demographic groups. Next, I turn to a more formal analysis of the long-run change between 1989 and 2024, examining the extent to which it reflects changes in population composition and changes in the correlates of attitudes toward automation. The final section concludes.
Expectations about unemployment and technological change
A large literature studies people’s macroeconomic expectations, with most of the focus on inflation expectations (D’Acunto and Weber (2024)). The smaller literature on unemployment expectations shows that expectations reflect both aggregate conditions and individuals’ circumstances and information environments. At the macro level, studies have examined whether unemployment expectations are adaptive or rational (Curtin (2003)). Using Italian data, Malgarini and Margani (2008) reject the rational expectations hypothesis for unemployment expectations, while Garz (2013) introduces news coverage as an additional explanatory factor and finds that media variables have a permanent effect on unemployment expectations in Germany.
At the micro level, individual unemployment expectations have been shown to depend on survey question design (Boctor et al. (2024)) and exposure to information about labor-market conditions. Guillochon (2024), for example, finds a relationship between exposure to news about regional unemployment and household expectations of nationwide unemployment. Personal circumstances and experiences also matter. Kuchler and Zafar (2019) find that personally experiencing unemployment increases pessimism about future nationwide unemployment, while Das, Kuhnen, and Nagel (2020) find that higher income and higher socioeconomic status reduce such pessimism.
The work on unemployment expectations discussed above relies on survey data that ask about short-run expectations, typically one year ahead, and that say nothing about the underlying reason for the anticipated change in unemployment. Far less is known about longer-run unemployment expectations, and the few studies that address them focus primarily on the impact of technology.
Studies of expectations about the employment effects of technology identify a range of individual-level correlates, although their importance varies across settings. Arntz, Blesse, and Doerrenberg (2026) ask respondents how they expect digital technologies to affect ‘future’ unemployment and find that those who mistrust the government are more likely to expect unemployment to increase. They also document substantial differences between the United States and Germany: political views and age predict expectations in the United States but not in Germany, whereas education and employment status matter in Germany but not in the United States. Similarly, Włoch, Śledziewska, and Rożynek (2025) find that an index of fear of automation, which includes concerns about automation-induced mass unemployment, is higher among younger and less-educated individuals but does not differ significantly by gender. Shoss and Ciarlante (2022) find that men and more highly educated respondents have more optimistic expectations about the impact of robots on jobs, whereas age and political beliefs show no significant association. Dekker, Salomons, and Waal (2017) similarly find that fear of robots at work, which includes concerns about their broader employment effects, is linked to both education and occupation.
National economic and institutional conditions may also help explain differences in attitudes toward automation. Shoss and Ciarlante (2022) show that higher income inequality is associated with a greater share of respondents believing that AI and robots will eliminate more jobs than they create. Dekker, Salomons, and Waal (2017) find greater fear of robots in countries characterized by less favorable economic conditions and weaker employment protection. Finally, Vu and Lim (2022) find that country-level characteristics, including economic development, government effectiveness, and innovation, are significantly associated with perceptions that robots and artificial intelligence will destroy more jobs than they create.
Taken together, these studies show that perceptions of technology’s employment effects vary systematically across individuals and countries. At the same time, the associations with characteristics such as age, education, employment status, gender, and political orientation are not uniform across studies or settings. Unlike the above papers, this paper does not focus on analyzing data from a survey at one point in time. Instead, I use surveys spanning a period of 35 years to examine how perceptions of technological unemployment evolve over time and whether the associations between respondent characteristics and those perceptions are stable across periods.
Data
I use individual-level survey data from five Eurobarometer surveys fielded between 1989 and 2024, providing a 35-year perspective on European public attitudes toward technological change and employment. The analysis combines Eurobarometer waves from 1989 (ZA1750), 1992 (ZA2295), 2005 (ZA4233), 2021 (ZA7782), and 2024 (ZA8904).1 The surveys contain repeated questions on attitudes toward science and technology, including a question concerning the expected employment consequences of technological change that forms the principal outcome of my analysis.
To maximize comparability over time, I construct a constant-country sample comprising the 12 countries or territories represented consistently across the five survey waves: Belgium, Denmark, West Germany, Greece, Italy, Spain, France, Ireland, Luxembourg, the Netherlands, Portugal, and the United Kingdom. East Germany is excluded in the later waves in order to preserve the geographic composition of the earlier samples. Great Britain and Northern Ireland are combined into a single UK category. The resulting design therefore holds the set of countries approximately constant rather than allowing changes in European Union membership to alter the composition of the pooled sample over time.
Our principal outcome captures respondents’ expectations about the employment consequences of technological change. Across the five waves, respondents were asked whether they agreed or disagreed with the proposition that new technology creates more jobs than it eliminates.
As shown in Table 1, the wording of the question changed somewhat across survey waves.
| Survey year | Technology referenced | Question wording |
|---|---|---|
| 1989, 1992 | Computers and factory automation | “On balance, computers and factory automation will create more jobs than they will eliminate.” |
| 2005 | Computers and factory automation | “Taking everything into account, computers and factory automation will create more jobs than they will eliminate.” |
| 2021, 2024 | Artificial intelligence and automation | “Artificial intelligence and automation will create more jobs than they will eliminate.” |
The change from “computers and factory automation” to “artificial intelligence and automation” means that the items are not literally identical, and the analysis therefore does not assume strict measurement equivalence across all five waves. Instead, I interpret them as functionally comparable questions about the expected net employment effects of the salient automation technologies of their respective periods. The evaluative proposition remains constant: respondents are asked whether technologies associated with the automation of work will create more jobs than they eliminate. What changes is the technological example through which that proposition is made concrete.
This distinction is important because literal wording invariance would not necessarily preserve substantive meaning over a 35-year period. Computers represented a prominent and potentially disruptive labor-saving technology in the late 1980s, whereas by 2024 they had become ubiquitous infrastructure. Asking contemporary respondents about “computers and factory automation” would therefore be unlikely to evoke the same kind of technological frontier that the wording evoked in 1989. Artificial intelligence and automation now occupy a more comparable position in public debate: like computers and factory automation in the earlier period, they are associated with the substitution of tasks, occupational restructuring, and uncertainty about aggregate employment.
The response labels vary slightly across waves: each survey contains a comparable five-point agreement scale, with the middle scale being consistently ‘neither agree nor disagree’. But the earlier surveys use ‘strongly’ (dis)agree and (dis)agree ‘to some extent’ while the later surveys use ‘totally’ (dis)agree and ‘tend to’ (dis)agree. I therefore harmonize responses into three substantive categories: Agree (the two agreement categories), Neither agree nor disagree, and Disagree (the two disagreement categories). “Don’t know” responses are retained separately.2
For pooled 12 country estimates, I use the Eurobarometer population weights appropriate to each wave. I additionally construct country-level weights for analyses of within-country trends, including the appropriate combined UK weight when Great Britain and Northern Ireland are treated as a single unit. Because the analysis focuses on a constant 12-country sample, the pooled estimates should be interpreted as representing the evolution of attitudes within this constant European geographic sample, rather than the changing membership of the European Union as a whole.
To distinguish attitudes toward the employment consequences of technology from broader sentiment toward science and technology, I also harmonize two repeated general S&T attitude items. The first asks whether science and technology make people’s lives healthier, easier, and more comfortable, providing a measure of general S&T optimism. The second asks whether science makes our way of life change too fast, providing a measure of concern about the pace of scientific and technological change. I harmonize these items using the same agreement categories as the employment measure.3
In the next section,I first focus on how perceptions of automation’s impact on employment have changed over time, and then on how the relationship between respondent characteristics and their perception has changed over time.
The Evolution of Perceptions of Automation’s Impact on Employment
The Evolution of Perceptions of Automation’s Impact on Employment - aggregated analysis of 12 European countries
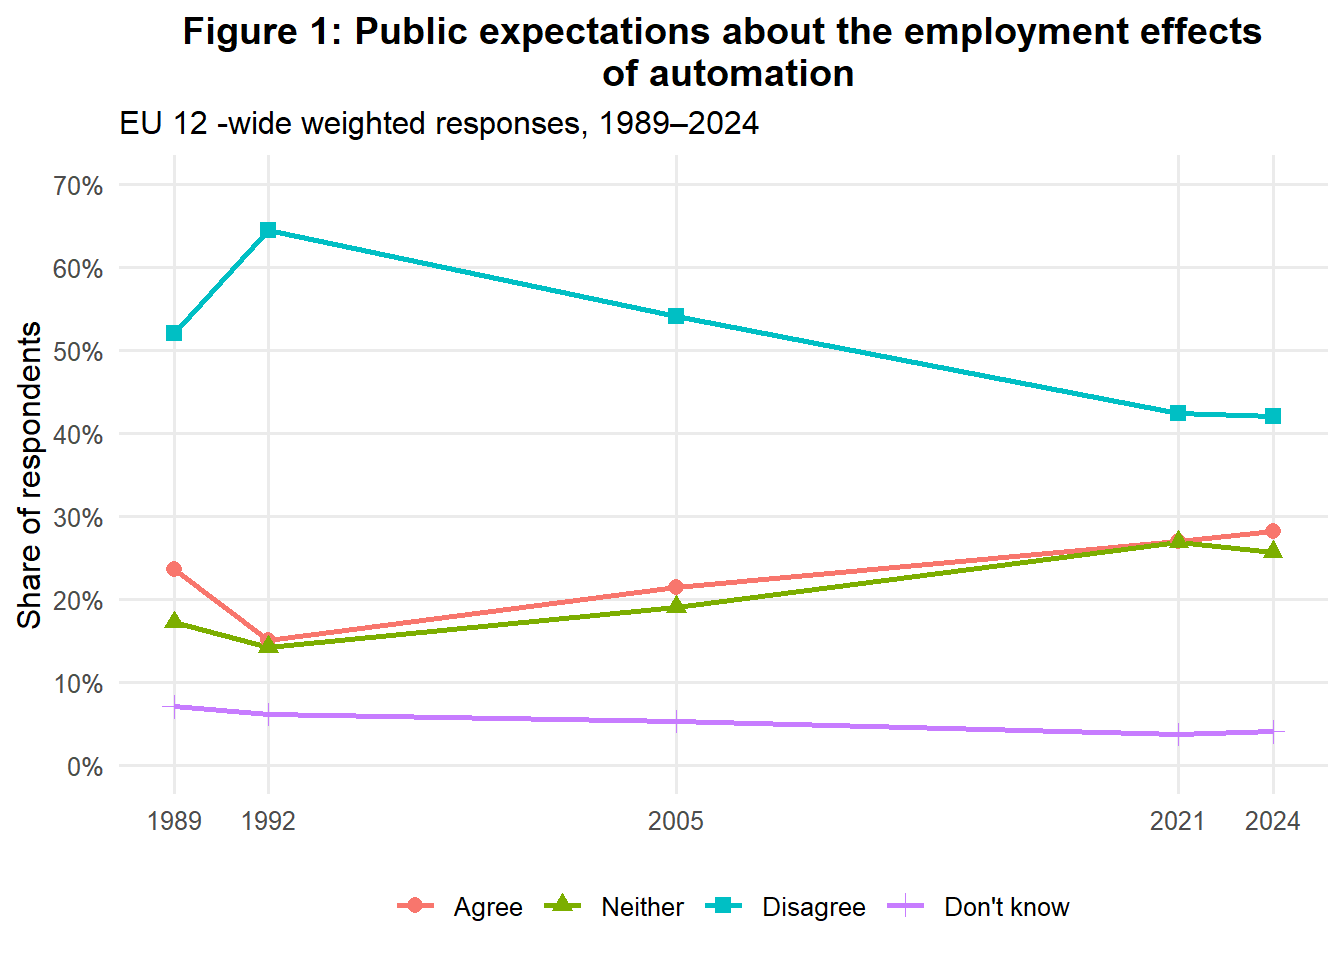
Figure 1 shows how aggregate expectations about the employment effects of automation have evolved over time. Overall, attitudes have become less pessimistic. The share of respondents who disagree that automation will create more jobs than it eliminates fell from 52.1 percent in 1989 - and a peak of 64.5 percent in 1992 - to 42.0 percent in 2024. Over the same period, the share who agree increased from 23.6 percent in 1989 to 28.2 percent in 2024, while the share who neither agree nor disagree rose more substantially, from 17.2 percent to 25.7 percent. Thus, the decline in pessimism about the employment effects of automation has been accompanied by increases in both optimism and, particularly, neutral responses.
Figure 1 thus suggests that the introduction of artificial intelligence into the question wording in 2021 and 2024 does not coincide with a return to the levels of pessimism observed in the early 1990s. Despite widespread contemporary concerns about the employment consequences of AI, respondents in the most recent surveys are substantially less likely to expect net job destruction than respondents were three decades earlier when the question referred to computers and factory automation.
The sharp increase in pessimism between 1989 and 1992 is also noteworthy. The share of respondents who disagreed that automation would create more jobs than it eliminated rose by more than 12 percentage points in just three years, illustrating that perceptions of the employment effects of technology can change substantially even over relatively short periods. One potential explanation is the economic downturn of the early 1990s, during which unemployment increased sharply across many European countries. This suggests that attitudes toward the employment consequences of technological change are influenced not only by developments in technology itself, but also by prevailing labor market conditions.
The Evolution of Perceptions of Automation’s Impact on Employment - country-level analysis
We next analyze whether the evolution of perceptions was similar across countries or not. Figure 2 shows long-run decline in pessimism observed at the European level is widespread across countries. Between 1989 and 2024, the share of respondents disagreeing that automation would create more jobs than it eliminates declined in 10 of the 12 countries in the sample. The two exceptions are Greece, where disagreement increased substantially, and Portugal, where it increased slightly.
As in the aggregated European results, 1992 stands out as an unusually pessimistic year, with perceptions deteriorating in all 12 countries relative to 1989.
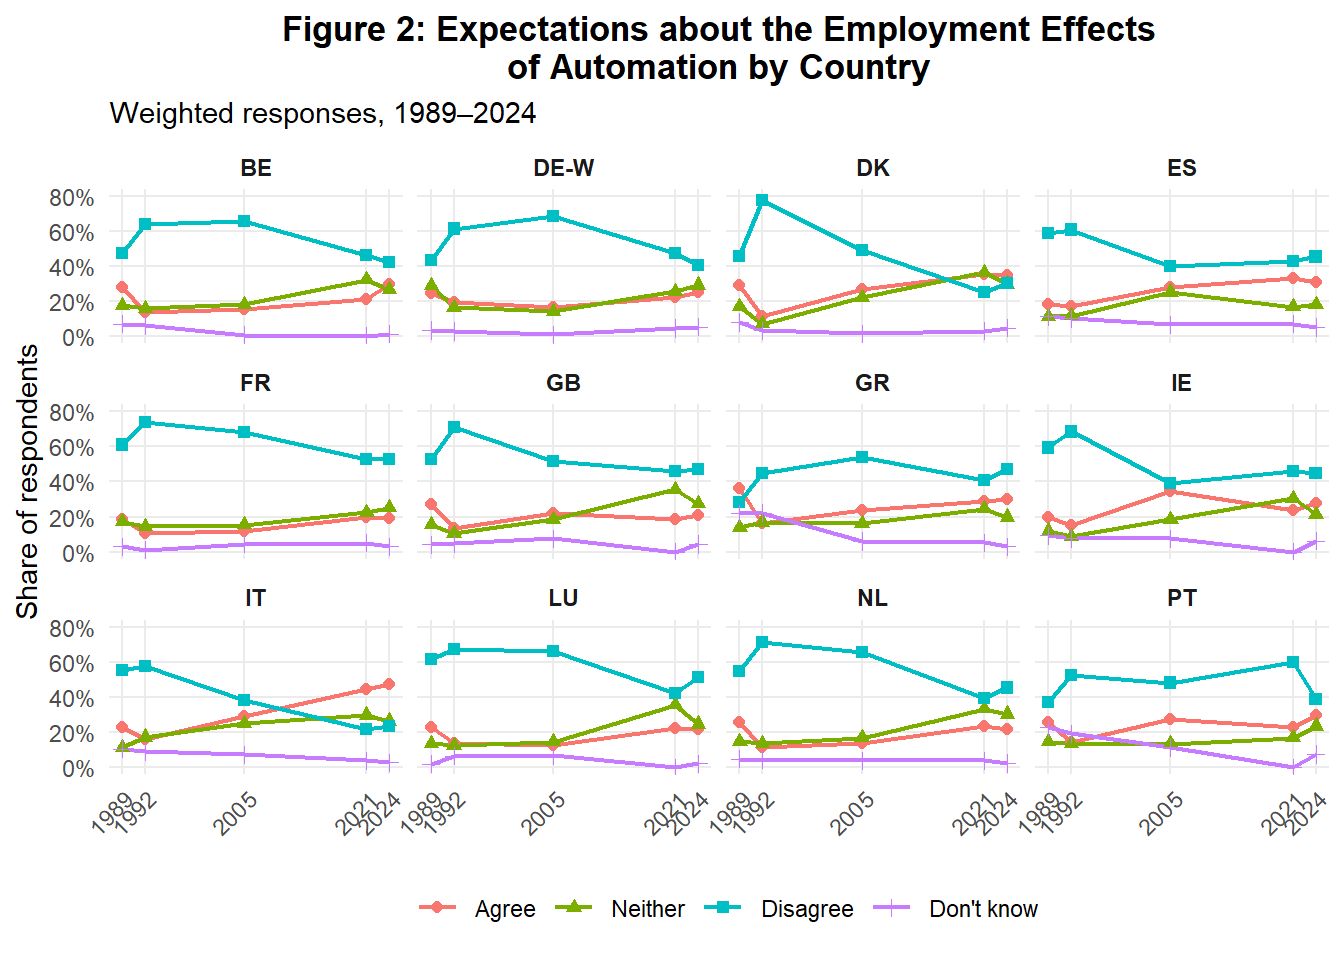
At the same time, there is substantial cross-country heterogeneity in the level of concern about automation. In 2024, for example, the share disagreeing ranges from 23.3 percent in Italy to 52.6 percent in France. These cross-country differences are not stable over time. Italy, for example, was among the more pessimistic countries in 1989, with 55.4 percent disagreeing, but had the lowest level of disagreement in 2024. Greece exhibits the opposite pattern, moving from the lowest level of disagreement in 1989 (28.4 percent) to one of the higher levels in 2024 (47.1 percent). This suggests that cross-country differences in attitudes toward the employment effects of automation cannot simply be attributed to persistent country-specific characteristics.
The Evolution of Perceptions of Automation’s Impact on Employment - Age Analysis
Next, I examine whether perceptions of the employment effects of automation vary with age. Age is particularly relevant for two reasons. First, recent discussions of generative AI have suggested that its labor-market effects may fall disproportionately on younger workers, who are more likely to be in entry-level positions and to perform tasks that can be substituted or complemented by AI (see for Lodefalk et al. (2026) or Westby, Modestino, and Cheng (2026)). Second, the age composition of the European population has changed substantially over the sample period. Reflecting this demographic shift, the average age of respondents in the Eurobarometer samples increased from approximately 42 years in 1989 to almost 52 years in 2024. Changes in aggregate attitudes toward automation could therefore partly reflect changes in the age composition of the population rather than changes in attitudes within age groups.
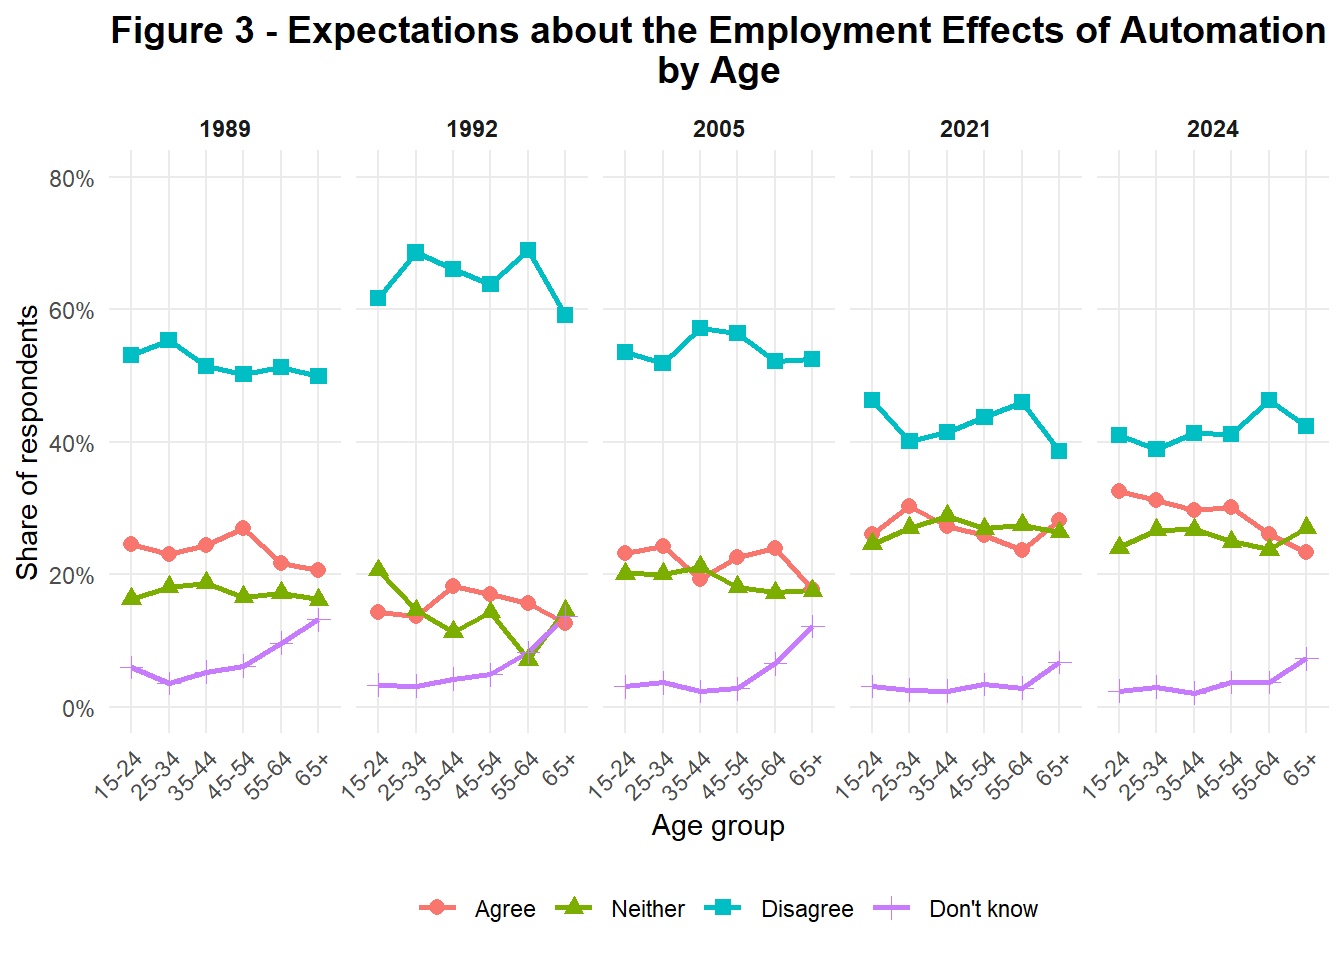
Figure 3 shows perceptions of the employment effects of automation by age group. There is little evidence of a systematic age gradient in attitudes, other than older people being more likely to answer they don’t know. Differences across age groups within a given survey wave are generally modest compared with changes in attitudes over time. In particular, the sharp increase in pessimism in 1992 and its subsequent decline are visible across all age groups. In the most recent wave, younger respondents are not more pessimistic about the employment consequences of AI and automation. In 2024, 42.0 percent of respondents aged 15–24 and 40.2 percent of those aged 25–34 disagree that AI and automation will create more jobs than they eliminate, compared with 48.1 percent among those aged 55–64 and 45.7 percent among those aged 65 and over. Thus, despite concerns that younger workers may be particularly exposed to generative AI, in this survey these concerns do not translate into greater pessimism among younger respondents about its aggregate employment effects.4
The relatively small differences across age groups also suggest that the substantial change in the age composition of the European population is unlikely to account for much of the long-run evolution in aggregate attitudes. Rather, the decline in pessimism appears to reflect changes in attitudes within age groups.
The Evolution of Perceptions of Automation’s Impact on Employment - Gender Analysis
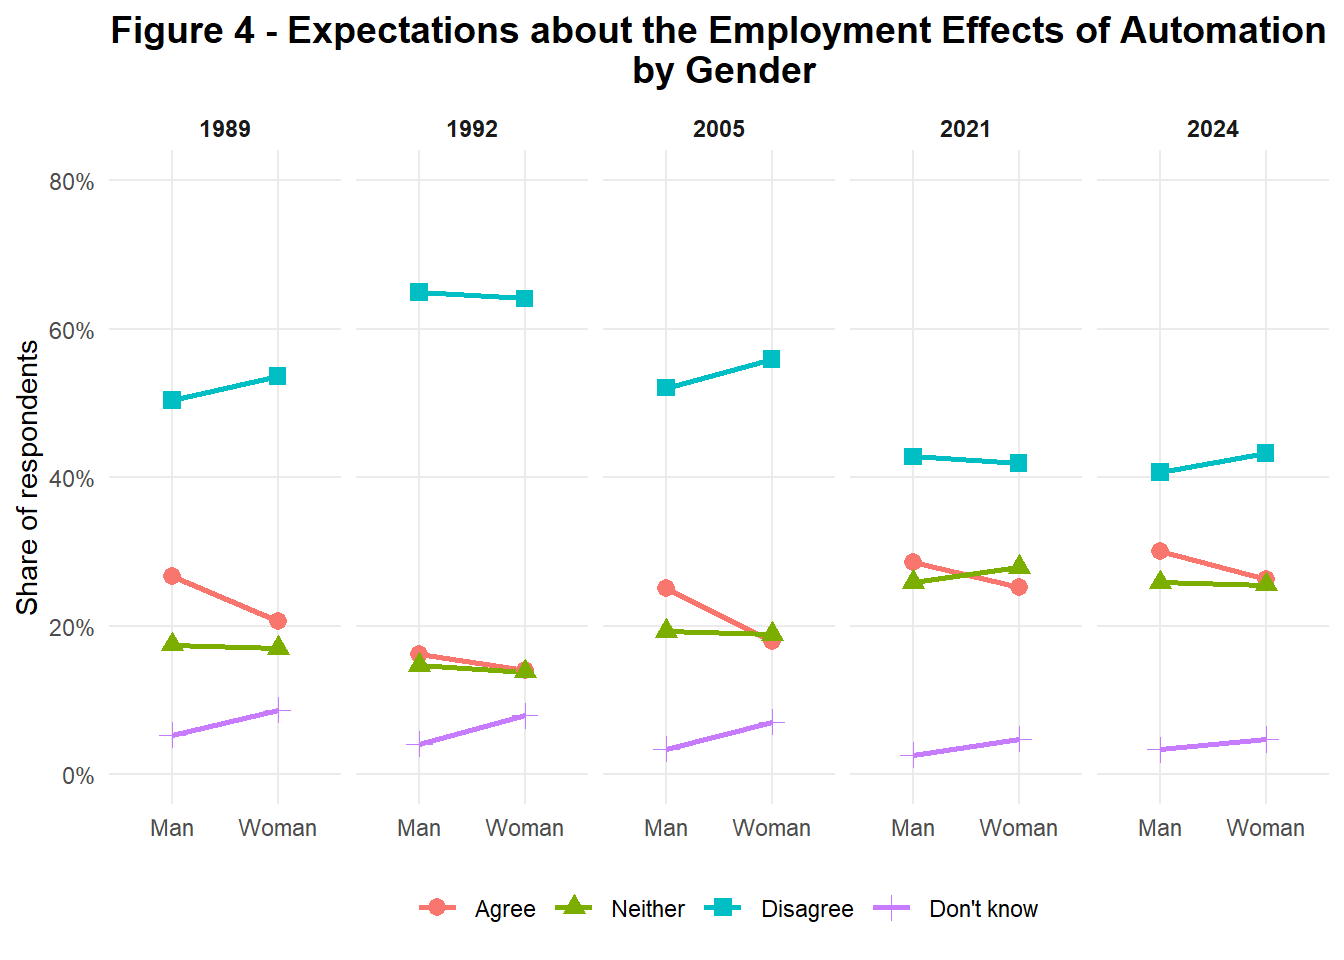
Figure 4 examines differences in perceptions by gender. Women are less likely than men to agree that automation will create more jobs than it eliminates in each of the five survey waves. The difference is particularly pronounced in 1989 and 2005, when the gender gap in agreement was 6.0 and 7.1 percentage points, respectively. However, lower agreement among women does not consistently translate into correspondingly higher disagreement. Instead, women are also more likely to answer “Don’t know” in every survey wave. In 1989, for example, 8.7 percent of women selected “Don’t know,” compared with 5.4 percent of men; in 2005 the corresponding shares were 7.1 and 3.5 percent. As with age, however, differences between survey waves are considerably larger than differences between men and women within a given wave.
The Evolution of Perceptions of Automation’s Impact on Employment - Political Orientation Analysis
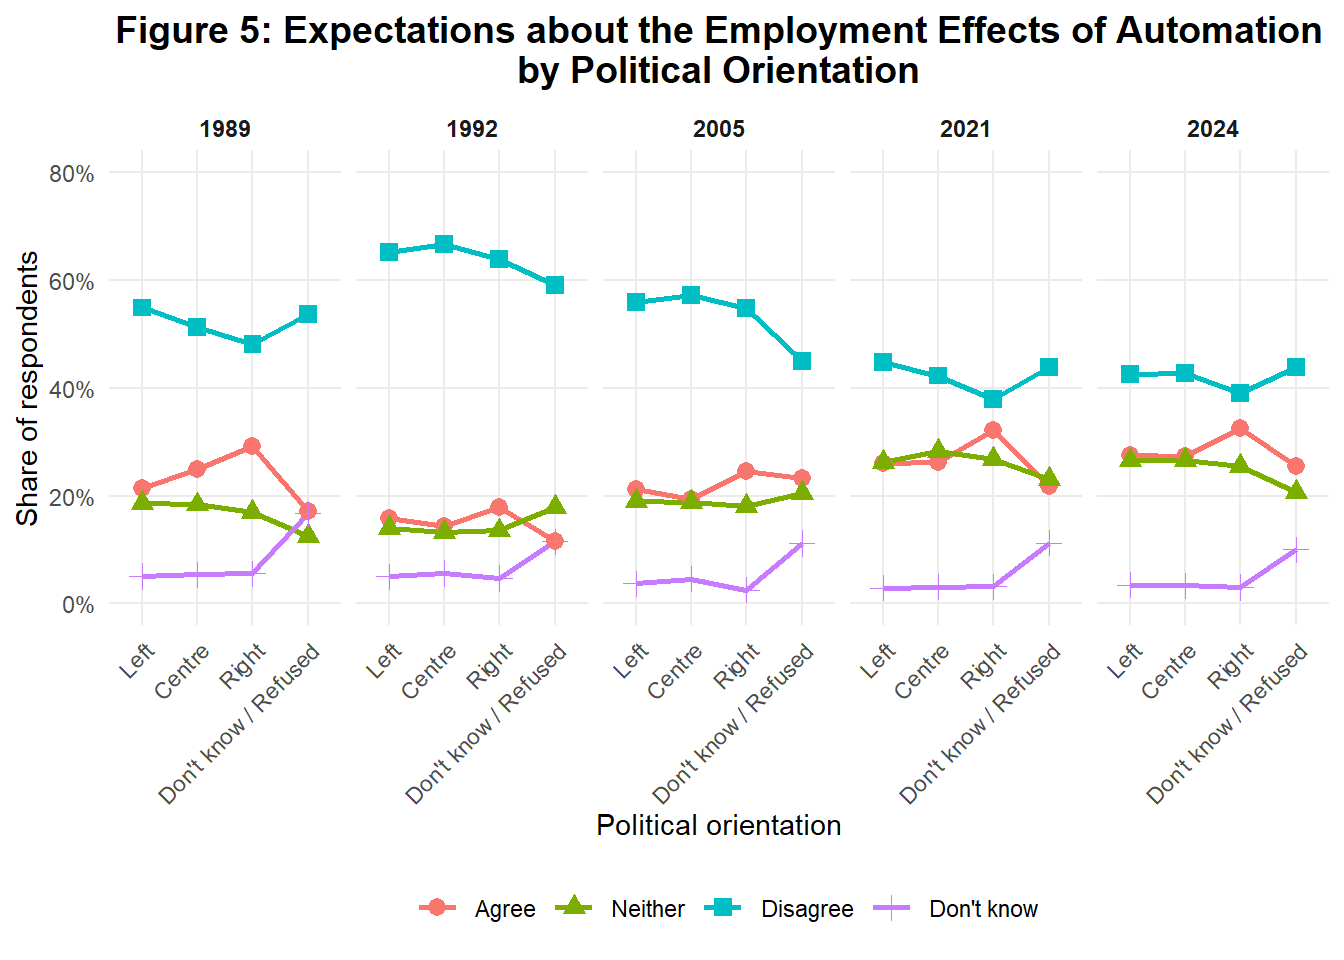
There is a large literature linking political views and automation (see Gallego and Kurer (2022) for a review) . Figure 5 therefore disaggregates perceptions by political orientation. Political differences in perceptions are generally modest and vary considerably across survey waves.5 An ideological gradient is visible in 1989 and 2021, when respondents on the right are more optimistic about the employment effects of automation than those on the left. In contrast, differences between left, centre, and right are relatively small in 1992, 2005 and 2024.
The Evolution of Perceptions of Automation’s Impact on Employment - Education Analysis
A large literature on skill-biased technological change (Autor, Katz, and Krueger (1998), Autor, Levy, and Murnane (2003)) suggests that the better educated tend to benefit more from technological change, which might lead them to view its employment consequences more favorably. The skill profile of exposure may not be constant over time, however. Whereas earlier waves of computerization primarily displaced manual and routine tasks, recent AI breakthroughs may bear more heavily on cognitive or “brain” work (Merola et al. (2026)). If so, the educational and occupational groups most exposed to automation, and thus potentially most pessimistic about it, may themselves have changed over the sample period. I therefore next examine how perceptions differ across educational and occupational categories.
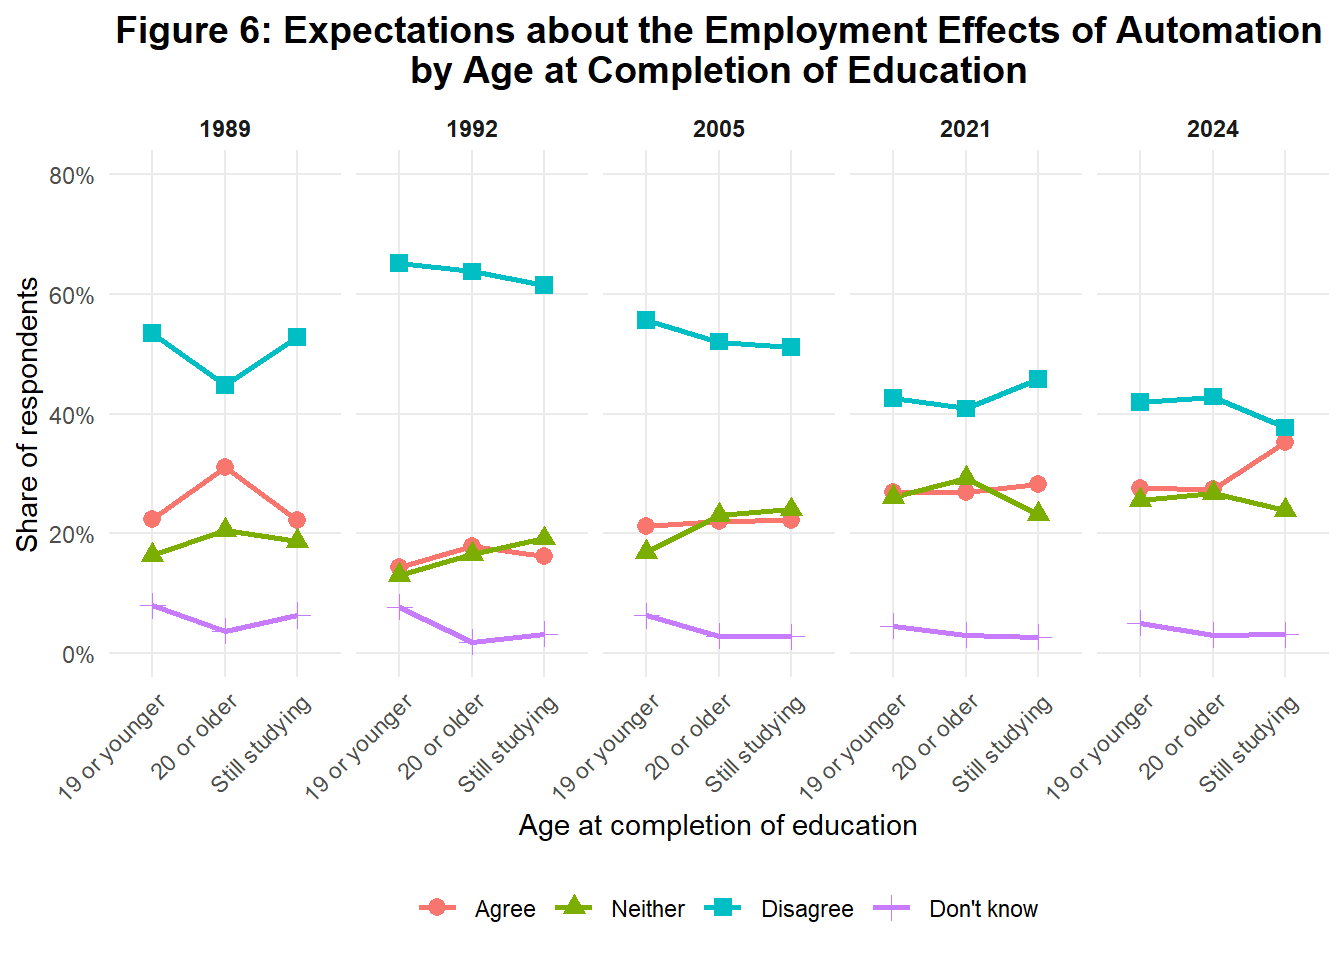
Because the surveys record age at completion of full-time education rather than educational qualifications, I distinguish between respondents who completed education at age 19 or younger, those who continued until age 20 or older, and those still studying. Continuing education beyond age 19 serves as a simple and consistently available proxy for higher educational attainment across survey waves.
The educational composition of the population has changed substantially over the sample period. In 1989, 73.6 percent of respondents had completed full-time education at age 19 or younger, while only 14.9 percent had continued their education until age 20 or later. By 2024, these shares were 55.2 and 36.6 percent, respectively. Thus, as with age, changes in aggregate attitudes toward automation could potentially reflect changes in population composition as well as changes in attitudes within demographic groups.
Figure 6 examines differences in perceptions by educational attainment. The relationship between education and attitudes toward automation varies considerably over time. In 1989, respondents who completed their education at age 20 or older were substantially more optimistic than those who left education earlier: 31.1 percent agreed that automation would create more jobs than it eliminated, compared with 22.3 percent among those who completed education at age 19 or younger. This educational gradient is considerably weaker in subsequent waves. In 1992, pessimism increased sharply across all three groups, while in 2005 and 2021 differences by educational attainment were relatively modest. By 2024, there is virtually no difference between the two groups who had completed their education: 27.6 percent of those who completed education at age 19 or younger agree and 41.9 percent disagree, compared with 27.5 and 42.8 percent, respectively, among those who completed education at age 20 or older. Respondents who were still studying were noticeably more optimistic, with 35.3 percent agreeing and 37.7 percent disagreeing.
The Evolution of Perceptions of Automation’s Impact on Employment - Occupation Analysis
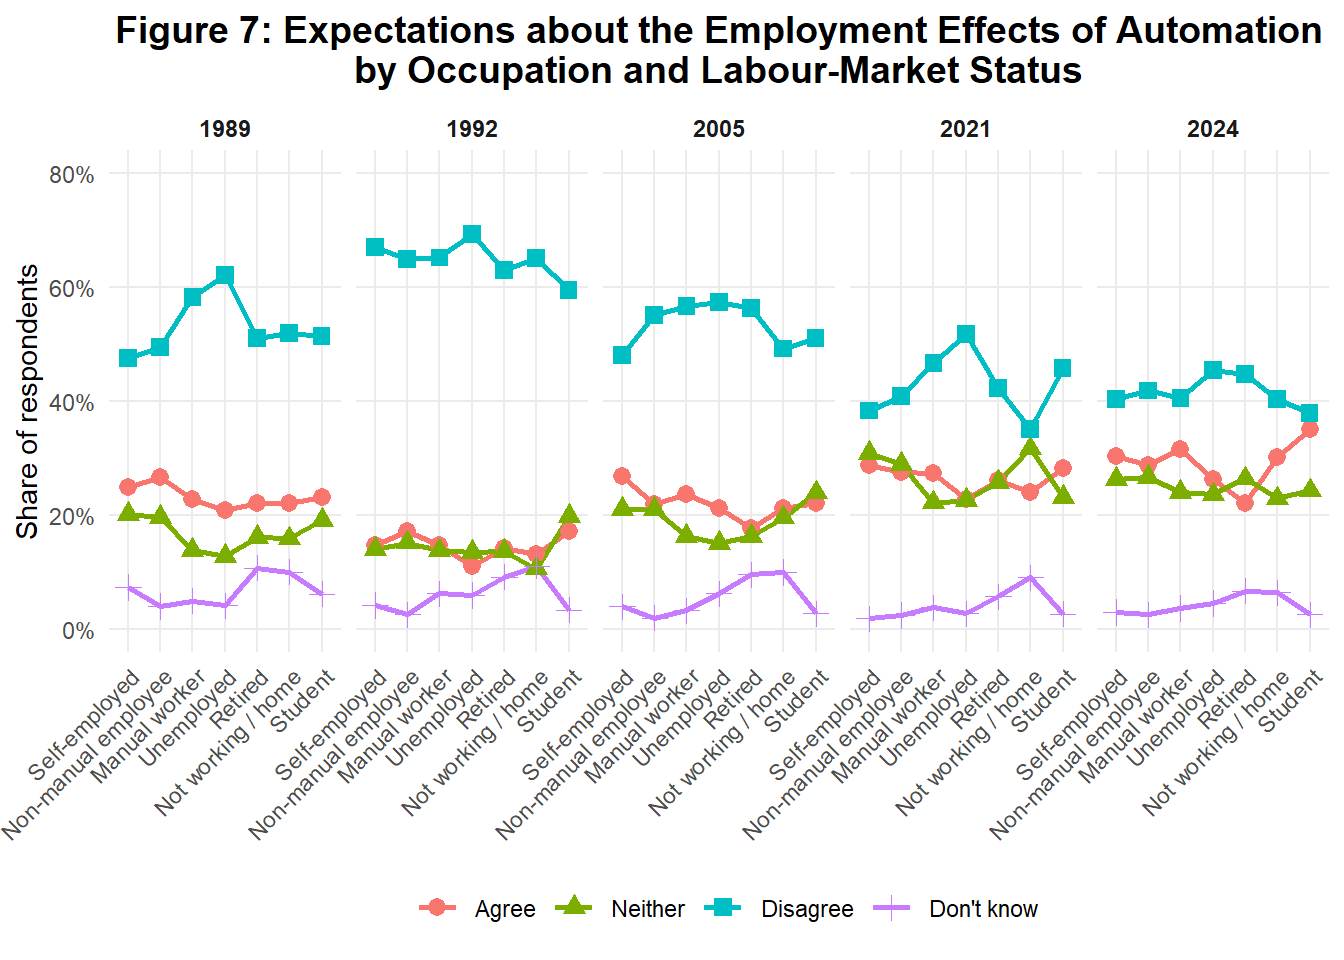
I also examine differences by occupation and labor-market status. The occupational classifications used in the Eurobarometer surveys remain largely consistent across waves, allowing us to construct seven harmonized categories: self-employed, non-manual employees, manual workers, unemployed, retired, not working or staying at home, and students. More detailed occupational categories in the original surveys are grouped into these broader categories to ensure comparability across years. Respondents in military service in 1989, for whom there is no comparable category in the other waves, are excluded from the occupational classification.
The occupational and labor-market composition of the population also changed considerably over the sample period. Most notably, the share of non-manual employees increased from 24.0 percent in 1989 to 35.5 percent in 2024, while the share of respondents classified as not working or staying at home declined from 19.9 to 5.1 percent. The share of retired respondents also increased substantially, from 17.7 to 25.3 percent, consistent with the aging of the population documented above. By contrast, the shares of self-employed, unemployed, and students changed relatively little. These compositional shifts provide an additional reason to examine whether perceptions of the employment effects of automation differ across occupational and labor-market groups.
Perceptions of the employment effects of automation also vary across occupational and labor-market groups. Unemployed respondents tend to be among the most pessimistic groups across survey waves. In 1989, for example, 62.1 percent of unemployed respondents disagreed that automation would create more jobs than it eliminated, compared with 47.5 percent of the self-employed and 49.6 percent of non-manual employees. The same broad pattern remains visible in later waves, although differences across occupations become smaller over time. In 2024, disagreement ranges from 37.9 percent among students to 45.4 percent among the unemployed. Students are also the most optimistic group in 2024, with 35.2 percent agreeing that automation will create more jobs than it eliminates.
There is little evidence of a persistent manual–non-manual divide in perceptions of the employment consequences of technological change. In 1989, manual workers were substantially more pessimistic: 58.2 percent disagreed that automation would create more jobs than it eliminated, compared with 49.6 percent of non-manual employees. This difference largely disappeared in 1992 and 2005, before re-emerging in 2021, when disagreement was 46.6 percent among manual workers and 40.9 percent among non-manual employees. By 2024, however, the two groups were again virtually indistinguishable, with 40.6 percent of manual workers and 41.9 percent of non-manual employees disagreeing.
The Evolution of Perceptions of Science and technology - “Science and technology make our lives healthier, easier and more comfortable”
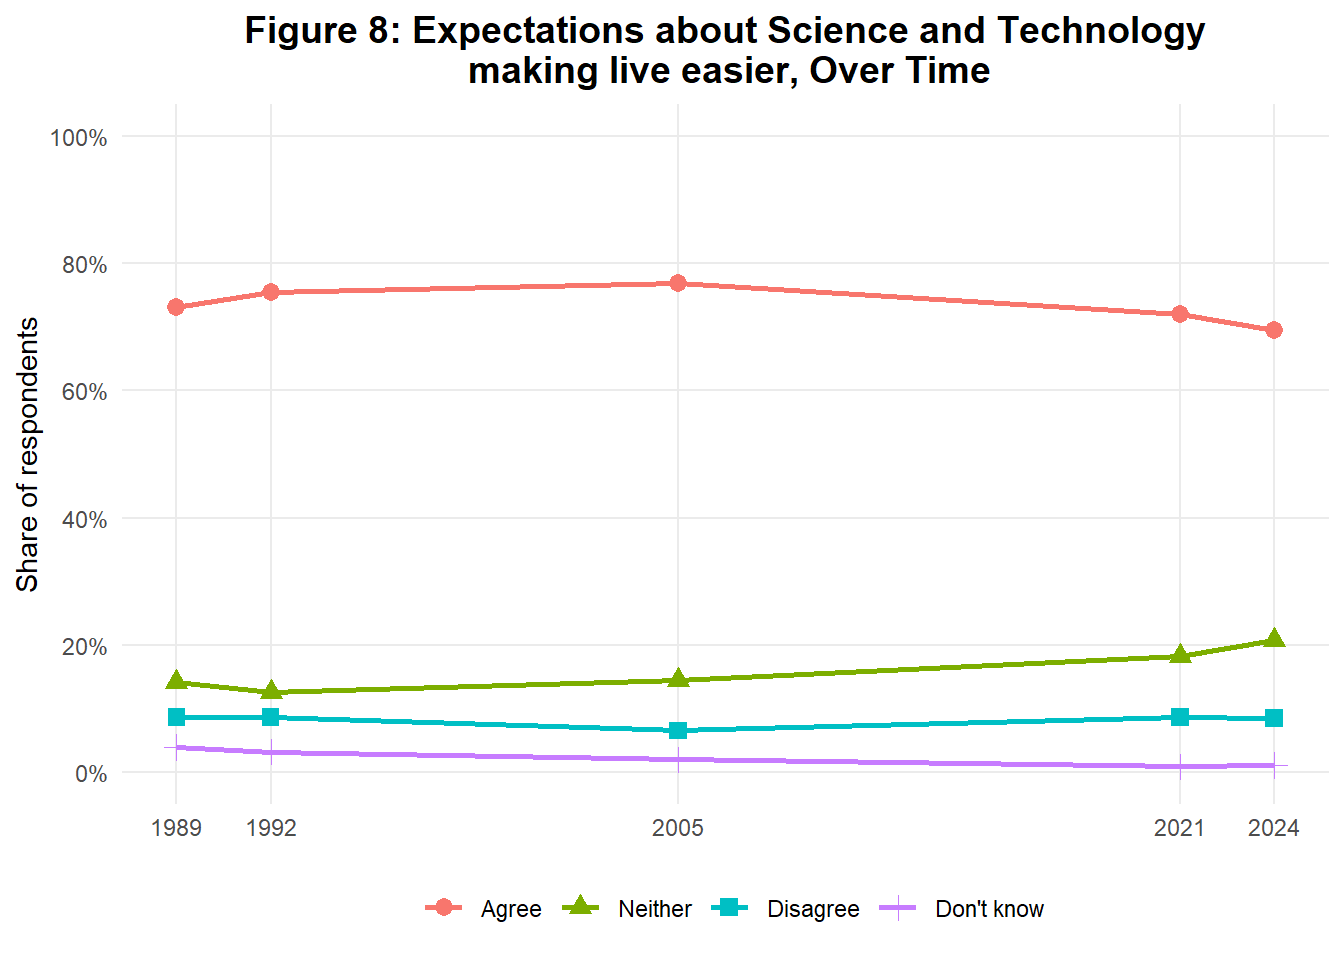
So far I focused on expectations about the impact of automation on jobs. The Eurobarometer surveys have additional questions that allow us to see whether the evolution I documented above is specific to employment expectations or reflect more general optimism. I first focus on the opinion about the statement that “science and technology make our lives healthier, easier and more comfortable”.
Figure 8 shows that general attitudes toward science and technology are considerably more stable than attitudes toward automation’s employment effects. Across all five waves, a large majority of respondents agree that science and technology make life healthier, easier, and more comfortable, with agreement ranging from 69.5 percent in 2024 to 76.8 percent in 2005. Disagreement remains close to 7–9 percent throughout the period. This stability contrasts sharply with the substantial variation over time in perceptions of automation’s employment consequences, suggesting that changes in employment-related concerns are not simply driven by broader shifts in attitudes toward science and technology.
The Evolution of Perceptions of Science and technology - “Science makes our way(s) of life change too fast”
At the same time, respondents express considerable concern about the pace of technological change. In every survey wave, at least half agree that science and technology change our way(s) of life too fast (figure 9). This share was relatively stable between 1989 and 2005, at between 55 and 59 percent, before falling to 50.3 percent in 2021. By 2024, however, it had increased to 58.8 percent, its highest level across the five waves, while disagreement fell from 26.0 percent in 2021 to 19.4 percent in 2024.
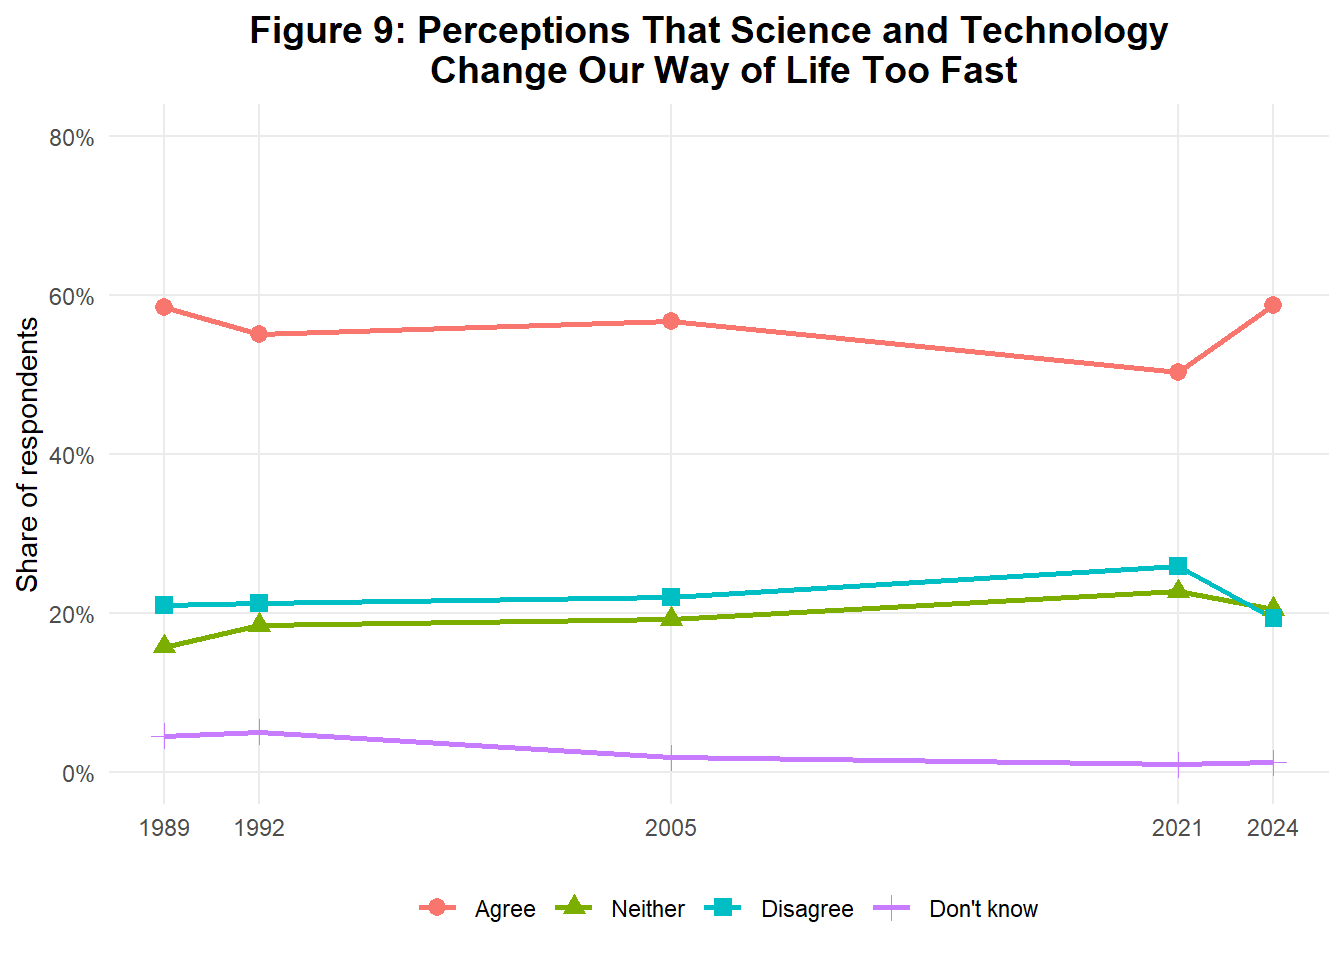
These broader attitudes toward science and technology provide useful context for interpreting perceptions of automation’s employment effects. In particular, concern about the pace of technological change does not appear to move in parallel with employment-related pessimism. Between 2021 and 2024, the share agreeing that science and technology change our way of life too fast increased sharply, from 50.3 to 58.8 percent. Over the same period, however, the share disagreeing that automation will create more jobs than it eliminates remained virtually unchanged, at around 42 percent, while the share agreeing increased slightly. This suggests that general anxiety about the speed of technological change is distinct from beliefs about its employment consequences.
The same distinction is apparent in 1992, the most pessimistic wave regarding automation and employment. Despite the sharp increase in employment-related pessimism, broader attitudes toward science and technology did not become more negative. If anything, respondents were slightly more likely to agree that science and technology make life healthier, easier, and more comfortable and less likely to agree that technological change was occurring too quickly than in 1989. The exceptional pessimism about automation in 1992 therefore appears to have been specific to its perceived employment consequences rather than part of a broader increase in technological pessimism.
An in-depth look at the long term change between 1989 and 2024
So far, the analysis has focused primarily on point estimates, as these are the differences most likely to shape public discussion and media coverage. I have not, however, systematically assessed whether the observed differences and changes over time are statistically significant. I therefore turn to a more formal analysis of the long-run change between 1989 and 2024. I begin with an Oaxaca–Blinder decomposition ( Oaxaca (1973), Blinder (1973)) to examine the extent to which the change in perceptions can be accounted for by changes in the observable composition of the population (such as the fact that respondents in 2024 are older and more highly educated than those in 1989) and how much instead reflects changes in the relationship between these characteristics and perceptions of automation’s employment effects.
For this long-run analysis, and to facilitate interpretation, I focus on disagreement with the statement that automation will create more jobs than it eliminates as the dependent variable. Disagreement is coded as one, while agreement and neutral responses are coded as zero. “Don’t know” responses are excluded from the analysis.
The Oaxaca–Blinder decomposition separates the observed change in disagreement between 1989 and 2024 into two components. The explained (composition) component captures the part of the change attributable to shifts in observable characteristics of respondents, such as age, education, occupation, political orientation, and country composition. It asks how disagreement would have changed if the relationships between these characteristics and disagreement had remained as in 1989, but the distribution of characteristics had changed to that observed in 2024. The remaining unexplained (coefficient) component captures changes in the relationship between these characteristics and disagreement, as well as changes in factors not observed in the model. I implement the decomposition using weighted linear probability models and Eurobarometer survey weights (see annex A for details).
The Oaxaca-Blinder composition shows that about 18 percent (2.2 percentage points from the 12.3 percentage points decline in disagreement between 1989 and 2024) can be explained by changes in the explanatory variables.
| Table 2: Oaxaca–Blinder decomposition of the change in disagreement, 1989–2024 | |||
|---|---|---|---|
| Component | Estimate (pp) | Bootstrap SE | 95% CI |
| Observed change | -12.32 | 1.00 | [-14.28, -10.36] |
| Explained by composition | -2.22 | 0.66 | [-3.52, -0.93] |
| Unexplained / coefficient component | -10.10 | 1.14 | [-12.32, -7.87] |
| Notes: 1989 coefficients are the reference for the composition component. Estimates are in percentage points. Standard errors and 95% CIs are from 1,000 stratified bootstrap replications. | |||
The explained component is driven primarily by the increase in educational attainment over time, while changes in the composition of the population with respect to age, gender, occupation, political orientation, and country weight contributed relatively little to the decline in disagreement.
| Table 3: Oaxaca–Blinder decomposition - Contribution of each variable | |||
|---|---|---|---|
| Characteristic | Contribution (pp) | Bootstrap SE | 95% CI |
| Age | -0.14 | 0.38 | [-0.89, 0.61] |
| Country | 0.45 | 0.18 | [0.08, 0.81] |
| Education | -2.53 | 0.45 | [-3.42, -1.64] |
| Gender | -0.01 | 0.07 | [-0.14, 0.12] |
| Occupation | 0.31 | 0.39 | [-0.45, 1.06] |
| Political orientation | -0.29 | 0.13 | [-0.55, -0.04] |
| Notes: 1989 coefficients are the reference for the composition component. Estimates are in percentage points. Standard errors and 95% CIs are from 1,000 stratified bootstrap replications. | |||
To illustrate the changes underlying the unexplained component of the decomposition, I next compare the estimated coefficients from the linear probability models for 1989 and 2024. This allows us to examine how the relationships between respondent characteristics and disagreement changed over time.
Comparing the estimated coefficients across the two years reveals substantial changes in the correlates of pessimism. Most notably, the pronounced educational and occupational gradients observed in 1989 had largely disappeared by 2024. Respondents who completed their education at age 20 or later were 11.1 percentage points less likely to disagree than those who completed their education earlier in 1989, whereas the corresponding difference was only 1.6 percentage points in 2024. Similarly, manual workers were 8.7 percentage points more likely to disagree than non-manual employees in 1989, but the difference was effectively zero in 2024. Both changes are highly statistically significant. Political differences also weakened: respondents in the centre and on the right were less likely to disagree than those on the left in 1989, while these differences had largely disappeared by 2024. The gender gap also narrowed significantly, although women remained somewhat more likely than men to disagree in 2024.
Overall, the results suggest that pessimism about the employment effects of automation has become less strongly stratified along educational, occupational, and, to some extent, political lines. The decline in aggregate pessimism therefore coincided with a substantial convergence in attitudes across several groups that differed markedly in 1989.
| Table 4: Comparing the stability of estimated coefficients of the Linear Probability Model, 1989 vs 2024 | |||||
|---|---|---|---|---|---|
| Characteristic | 1989 coefficient | 2024 coefficient | Change | SE of change | p-value |
| Age | −0.02 | 0.11 | 0.13 | 0.06 | 0.023 |
| Woman | 6.47 | 3.15 | −3.32 | 1.45 | 0.022 |
| Education: 20 or older | −11.09 | −1.55 | 9.54 | 1.77 | <0.001 |
| Education: Still studying | 4.14 | 0.92 | −3.22 | 5.12 | 0.529 |
| Ideology: Centre | −3.54 | 0.19 | 3.72 | 1.65 | 0.024 |
| Ideology: Right | −5.04 | −1.33 | 3.71 | 1.91 | 0.052 |
| Ideology: Don't know / Refused | 4.76 | 3.92 | −0.84 | 2.30 | 0.715 |
| Occupation: Self-employed | −0.82 | 0.64 | 1.46 | 2.65 | 0.582 |
| Occupation: Manual worker | 8.72 | 0.28 | −8.44 | 2.29 | <0.001 |
| Occupation: Unemployed | 7.60 | 2.26 | −5.34 | 3.31 | 0.106 |
| Occupation: Retired | 4.71 | 1.27 | −3.45 | 2.55 | 0.177 |
| Occupation: Not working / home | −0.23 | 0.22 | 0.45 | 2.83 | 0.874 |
| Occupation: Student | −5.41 | −1.89 | 3.52 | 5.05 | 0.486 |
| Notes: Coefficients (in percentage points) from weighted linear probability models of disagreement estimated separately for 1989 and 2024, together with the change between the two years, its standard error, and the associated p-value. The models include age, gender, education, political orientation, occupation, and country; the outcome and sample are as defined in Table 2. Coefficients are conditional on all other included characteristics and therefore differ from the unconditional shares reported in the figures. Estimates use the pooled population weight. Reference categories are male, left-leaning, non-manual employee, resident in Belgium, and education completed at 19 or younger. | |||||
tab
The country coefficients provide further evidence that the evolution of attitudes was not uniform across Europe. The most striking change concerns Italy. Conditional on individual characteristics, Italian respondents were 9.6 percentage points more likely than Belgian respondents to disagree in 1989, but 20.8 percentage points less likely in 2024, a relative shift of 30.4 percentage points. Greece experienced a substantial movement in the opposite direction, with its position relative to Belgium increasing by 18.9 percentage points. Significant relative shifts are also observed for Denmark and Spain. By contrast, the relative positions of most other countries did not change significantly.
These results suggest that the long-run decline in pessimism cannot be understood simply as a common European trend operating uniformly across countries. Instead, there has been a substantial reshuffling of the cross-country pattern of attitudes. Moreover, because these estimates control for age, gender, education, political orientation and occupation, the changing country differences cannot readily be attributed to differences in the observed composition of national populations. They point instead to the importance of country-specific developments and other contextual factors not captured by the individual-level characteristics included in the model.
| Table 5: Comparing the stability of estimated country coefficients of the Linear Probability Model, 1989 vs 2024 | |||||
|---|---|---|---|---|---|
| Country | 1989 coefficient | 2024 coefficient | Change | SE of change | p-value |
| DE-W | −7.01 | −0.63 | 6.38 | 4.06 | 0.116 |
| DK | 2.29 | −10.68 | −12.97 | 6.49 | 0.046 |
| ES | 13.39 | 4.25 | −9.14 | 4.25 | 0.031 |
| FR | 12.08 | 10.49 | −1.59 | 4.09 | 0.698 |
| GB | 4.40 | 6.11 | 1.71 | 4.08 | 0.675 |
| GR | −14.21 | 4.71 | 18.93 | 5.51 | <0.001 |
| IE | 14.23 | 5.20 | −9.02 | 7.34 | 0.219 |
| IT | 9.59 | −20.82 | −30.42 | 4.13 | <0.001 |
| LU | 13.88 | 9.94 | −3.94 | 17.65 | 0.824 |
| NL | 9.30 | 4.08 | −5.21 | 4.85 | 0.282 |
| PT | −5.37 | −1.33 | 4.04 | 5.60 | 0.470 |
| Notes: Estimated country coefficients (in percentage points) for 1989 and 2024 and their change, from an interaction specification allowing each characteristic's coefficient to differ between the two years. Country coefficients are relative to the reference country (Belgium) and are conditional on age, gender, education, political orientation, and occupation. Estimates use the pooled population weight. The sample and outcome are as defined in Table 2. | |||||
Conclusion
Rapid advances in artificial intelligence have revived longstanding concerns that technological change may eliminate jobs faster than it creates them. Much of the current debate, however, relies on contemporary surveys and therefore provides little indication of whether today’s concerns are historically unusual. This paper places these attitudes in a longer-run perspective by using five waves of Eurobarometer surveys spanning 1989 to 2024 and covering 12 European countries.
The results provide little evidence that Europeans are currently more pessimistic about the employment consequences of technological change than they were in the past. In 2024, 42 percent of respondents disagreed that AI and automation would create more jobs than they eliminate. While this represents substantial concern, the corresponding share of respondents who disagreed that computers and factory automation would create more jobs than they eliminate, exceeded 50 percent in 1989 and reached almost 65 percent in 1992. Conversely, the share expecting automation to create more jobs than it eliminates increased from 23.6 percent in 1989 to 28.2 percent in 2024. Viewed from a 35-year perspective, therefore, contemporary anxiety about the employment consequences of AI does not appear historically exceptional.
Perhaps the most striking feature of the data is the substantial variation in attitudes over time. In particular, pessimism increased sharply between 1989 and 1992 across virtually all countries and demographic groups. This episode illustrates how quickly perceptions of the employment consequences of technology can change and suggests that attitudes observed at any particular point in time should not necessarily be interpreted as persistent beliefs. The coincidence of the 1992 peak in pessimism with the economic downturn and rising unemployment of the early 1990s also raises the possibility that perceptions of technological displacement are shaped by broader economic conditions.
The aggregate European pattern masks substantial heterogeneity. Countries differ considerably in their levels of concern, and their relative positions change over time. At the individual level, differences by age, gender, education, political orientation, and occupation are generally modest relative to changes between survey waves and, importantly, are not stable over time. Women tend to be less optimistic about the employment effects of automation than men, while relationships with age, education, political orientation, and occupation vary considerably across waves. Occupational differences are somewhat more pronounced in some periods: unemployed respondents are often among the more pessimistic groups, while the gap between manual and non-manual workers varies substantially and is virtually absent in 2024. These results caution against treating relationships identified in a single contemporary survey as enduring features of attitudes toward technological change.
The formal analysis of the long-run change between 1989 and 2024 reinforces this conclusion. An Oaxaca–Blinder decomposition shows that changes in the observable composition of the population account for only a relatively small part of the decline in disagreement. The explained component is driven primarily by rising educational attainment, while changes in age, gender, occupation, political orientation, and country composition contribute comparatively little. Most of the decline is instead contained in the unexplained, or coefficient, component, indicating that the relationships between observed characteristics and attitudes have themselves changed over time, alongside the possible influence of factors not captured by the model.
Comparing the estimated relationships in 1989 and 2024 reveals a notable weakening of several of the socioeconomic and political gradients that characterized attitudes in 1989. Respondents who completed their education at age 20 or later were substantially less likely to be pessimistic than those who completed their education earlier in 1989, but this educational difference had almost disappeared by 2024. An even clearer convergence occurred across occupations. Manual workers were substantially more likely than non-manual employees to express pessimism in 1989, whereas the difference was effectively zero in 2024. The gender gap also narrowed, and there is evidence that differences by political orientation weakened. Thus, the decline in aggregate pessimism has been accompanied by a broader convergence in attitudes across several socioeconomic and political groups.
This convergence across individual characteristics, however, has not been matched by a simple convergence across countries. Country effects changed significantly between 1989 and 2024 even after controlling for demographic characteristics, education, political orientation, and occupation. Particularly large changes occurred in the relative positions of Italy and Greece, with significant shifts also observed for Denmark and Spain. The countries in which respondents are relatively more or less pessimistic have therefore changed substantially over time. This suggests that national differences do not simply reflect persistent country-specific attitudes toward technology. Instead, country context—and potentially differences in economic experience, labor-market institutions, technological adoption, or public debate—may play an important role in shaping how technological change is perceived.
Taken together, the decomposition and regression results qualify explanations of attitudes toward automation that rely primarily on changing population composition or stable differences in individual exposure to technological risk. European societies have aged, educational attainment has increased, and employment has shifted toward non-manual occupations, but these changes explain only a limited part of the long-run decline in pessimism. More strikingly, groups that differed substantially in their views in 1989 often held much more similar views by 2024. At the same time, the reshuffling of country differences suggests that the broader economic and institutional environment in which technological change occurs may be at least as important as individual characteristics.
The comparison with broader attitudes toward science and technology further suggests that concerns about employment are distinct from general technological optimism or anxiety. Throughout the period, around 70 percent or more of respondents believe that science and technology make life healthier, easier, and more comfortable. At the same time, a majority generally agree that science and technology change our way of life too quickly. Most revealingly, 1992, the year with by far the greatest pessimism about automation and employment, was not characterized by unusually negative attitudes toward science and technology more generally. Likewise, between 2021 and 2024, concern about the speed of technological change increased substantially even as pessimism about the employment effects of automation remained essentially unchanged. People can therefore simultaneously recognize the benefits of technological progress, feel uneasy about its pace, and hold quite different beliefs about its consequences for employment.
These findings offer an important perspective on the current debate surrounding generative AI. Predictions of widespread technological unemployment and surveys documenting public concern should be taken seriously, particularly because such beliefs may themselves influence consumer sentiment and support for policies governing technological adoption. But current attitudes should also be viewed in historical context. Europeans have worried about the employment consequences of new technologies for decades, and at several points they have been considerably more pessimistic than they are today. Moreover, these attitudes have proven capable of changing substantially over relatively short periods, both within socioeconomic groups and across countries.
The history documented here therefore provides reasons for caution in interpreting today’s AI anxiety as evidence that public perceptions have entered an unprecedented new era. Whether generative AI ultimately proves fundamentally different from previous technological changes remains an open question. What the evidence does show is that public expectations about technology and employment are neither fixed nor simply determined by who people are or the jobs they hold. They evolve with the broader historical and national context in which technological change takes place. And although both the level of concern and its socioeconomic and national patterning have shifted substantially over the past 35 years, the level of pessimism about AI and jobs today remains below that of the early 1990s. In that sense, when it comes to public expectations about technology and jobs, this time does not yet look so different.
Annex A: Oaxaca-Blinder Decomposition
The outcome is a binary indicator equal to one if a respondent disagrees that automation will create more jobs than it eliminates :
For each year
where
Since the weighted fit passes through the weighted means,
I apply a twofold Oaxaca–Blinder decomposition with the 1989 coefficients as the reference:
The explained component captures the change attributable to shifts in the observable composition of the population, valued at the 1989 relationships; the unexplained component captures the change attributable to differences in the estimated coefficients (and factors not captured by
For the detailed decomposition, let
The intercept contributes zero to the composition component (
References
Arntz, Melanie, Sebastian Blesse, and Philipp Doerrenberg. 2026. “The End of Work Feels Near. How Do People Perceive the Impact of Digital Technologies and Automation?” Labour Economics 102: 102897. https://doi.org/https://doi.org/10.1016/j.labeco.2026.102897.
Autor, David H., Lawrence F. Katz, and Alan B. Krueger. 1998. “Computing Inequality: Have Computers Changed the Labor Market?” Quarterly Journal of Economics 113 (4): 1169–1213. https://doi.org/10.1162/003355398555874.
Autor, David H., Frank Levy, and Richard J. Murnane. 2003. “The Skill Content of Recent Technological Change: An Empirical Exploration.” Quarterly Journal of Economics 118 (4): 1279–1333. https://doi.org/10.1162/003355303322552801.
Blinder, Alan S. 1973. “Wage Discrimination: Reduced Form and Structural Estimates.” Journal of Human Resources 8 (4): 436–55. https://doi.org/10.2307/144855.
Boctor, Valerie R., Olivier Coibion, Yuriy Gorodnichenko, and Michael Weber. 2024. “On Eliciting Subjective Probability Distributions of Expectations.” Working Paper, NBER working paper series, no. 32406. https://doi.org/10.3386/w32406.
Caprettini, Bruno, and Hans-Joachim Voth. 2020. “Rage Against the Machines: Labor-Saving Technology and Unrest in Industrializing England.” American Economic Review: Insights 2 (3): 305–20. https://doi.org/10.1257/aeri.20190385.
Curtin, Richard. 2003. “Unemployment Expectations: The Impact of Private Information on Income Uncertainty.” Review of Income and Wealth 49 (4): 539–54. https://doi.org/10.1111/j.0034-6586.2003.00104.x.
D’Acunto, Francesco, and Michael Weber. 2024. “Why Survey-Based Subjective Expectations Are Meaningful and Important.” Annual Review of Economics 16 (1): 329–57. https://doi.org/10.1146/annurev-economics-091523-043659.
Das, Sreyoshi, Camelia M. Kuhnen, and Stefan Nagel. 2020. “Socioeconomic Status and Macroeconomic Expectations.” The Review of Financial Studies 33 (1): 395–432. https://doi.org/10.1093/rfs/hhz041.
Dekker, Fabian, Anna Salomons, and Jeroen van der Waal. 2017. “Fear of Robots at Work: The Role of Economic Self-Interest.” Socio-Economic Review 15 (3): 539–62. https://doi.org/10.1093/ser/mwx005.
Gallego, Aina, and Thomas Kurer. 2022. “Automation, Digitalization, and Artificial Intelligence in the Workplace: Implications for Political Behavior.” Annual Review of Political Science 25: 463–84. https://doi.org/10.1146/annurev-polisci-051120-104535.
Garz, Marcel. 2013. “Unemployment Expectations, Excessive Pessimism, and News Coverage.” Journal of Economic Psychology 34: 156–68. https://doi.org/10.1016/j.joep.2012.10.007.
Greenhouse, Steven. 2025. “Most People Aren’t Fretting about an AI Bubble. What They Fear Is Mass Layoffs.” The Guardian, December. https://www.theguardian.com/commentisfree/2025/dec/12/ai-bubble-mass-layoffs-income-inequality.
Guillochon, Justine. 2024. “News-Driven Household Macroeconomic Expectations: Regional Vs. National Telecast Information.” Journal of Money, Credit and Banking. https://doi.org/10.1111/jmcb.13246.
Haslberger, Matthias, Jane Gingrich, and Jasmine Bhatia. 2025. “Rage Against the Machine? Generative AI Exposure, Subjective Risk, and Policy Preferences.” Journal of European Public Policy 0 (0): 1–28. https://doi.org/10.1080/13501763.2025.2554903.
Kuchler, Theresa, and Basit Zafar. 2019. “Personal Experiences and Expectations about Aggregate Outcomes.” Journal of Finance 74 (5): 2491–2542. https://doi.org/10.1111/jofi.12819.
Lange, Jason, and Alexandra Alper. 2025. “Americans Fear AI Permanently Displacing Workers, Reuters/Ipsos Poll Finds.” CNBC, August. https://www.cnbc.com/2025/08/19/americans-fear-ai-permanently-displacing-workers-reuters/ipsos-poll-finds.html.
Lee, Jaewook. 2024. “Luddite or Technophile? — Policy Preferences for Governing Technology-Driven Economic Change.” Socio-Economic Review 22 (3): 1019–46. https://doi.org/10.1093/ser/mwae025.
Lodefalk, Magnus, Lydia Löthman, Michael Koch, and Erik Engberg. 2026. “Same Storm, Different Boats: Generative AI and the Age Gradient in Hiring.” Ratio Working Paper 388. Stockholm, Sweden: The Ratio Institute. https://cms.ratio.se/app/uploads/2026/03/lodefalk_march16_paper_v2-kombinerades.pdf.
Malgarini, Marco, and Patrizia Margani. 2008. “Unemployment Expectations Across Heterogeneous Groups.” Economics Bulletin 4 (31): 1–6.
Merola, Rossana, Ekkehard Ernst, Daniel Samaan, Maria del Rio-Chanona, and Ole Teutloff. 2026. “Workers’ Exposure to AI: What Indicators Tell Us — and What They Don’t.” ILO Research Brief. Geneva: International Labour Organization. https://doi.org/10.54394/00033279.
Mokyr, Joel, Chris Vickers, and Nicolas L. Ziebarth. 2015. “The History of Technological Anxiety and the Future of Economic Growth: Is This Time Different?” Journal of Economic Perspectives 29 (3): 31–50.
Oaxaca, Ronald. 1973. “Male-Female Wage Differentials in Urban Labor Markets.” International Economic Review 14 (3): 693–709. https://doi.org/10.2307/2525981.
Shiller, Robert J. 2026. “This Doommaxxing Has Got to Stop.” The New York Times, June. https://www.nytimes.com/2026/06/22/opinion/ai-doom-jobs-economy.html.
Shoss, Mindy K., and Katherine Ciarlante. 2022. “Are Robots/AI Viewed as More of a Workforce Threat in Unequal Societies? Evidence from the Eurobarometer Survey.” Technology, Mind, and Behavior 3 (2). https://doi.org/10.1037/tmb0000078.
Vu, Hong Tien, and Jeongsub Lim. 2022. “Effects of Country and Individual Factors on Public Acceptance of Artificial Intelligence and Robotics Technologies: A Multilevel SEM Analysis of 28-Country Survey Data.” Behaviour & Information Technology 41 (7): 1515–28. https://doi.org/10.1080/0144929X.2021.1884288.
Westby, Samuel, Alicia Sasser Modestino, and Peiran Cheng. 2026. “Generative AI and the Redefinition of Entry-Level Software Work.” IZA Discussion Paper 18723. IZA. https://www.iza.org/publications/dp/18723/generative-ai-and-the-redefinition-of-entry-level-software-work.
Włoch, Renata, Katarzyna Śledziewska, and Satia Rożynek. 2025. “Who’s Afraid of Automation? Examining Determinants of Fear of Automation in Six European Countries.” Technology in Society. https://doi.org/10.1016/j.techsoc.2024.102782.
Wu, J., Y. Zhang, W. Jin, et al. 2026. “The Impact of Information Type on AI Threat Perception: Evidence from AI Unemployment Scenarios.” Current Psychology 45: 325. https://doi.org/10.1007/s12144-025-08989-0.
Footnotes
All data are publicly available from https://www.gesis.org/en/eurobarometer-data-service.↩︎
In 1992 and 2005, there is a split ballot so not all respondents are asked the same questions. For those years, the sample size is about 6000 respondents, about half of respondents were asked the relevant question. Respondents who were not administered a particular split-ballot item are treated as structurally missing rather than as substantive “Don’t know” responses. For the other years I have about 12000 respondents, so about 1000 per country.↩︎
In 2021 the general optimism item was administered to approximately half of respondents (split ballot).↩︎
This contrasts with Włoch, Śledziewska, and Rożynek (2025), who find greater fear of automation among younger individuals in six Central European countries. This difference could reflect country differences or the fact that their fear of automation includes personal fears.↩︎
Eurobarometer surveys ask respondents to place themselves on left -right scale, with 1 being the most left and 10 being the most right. Those answering 1 to 4 are categorized as left, 5-6 as centre and 7-10 as right. Since a relatively large share of respondents refuse or do not answer this question, I include those as a separate category.↩︎