| Table 1 - Opinion on 'Tariffs harm the global Economy', before and after Liberation Day | ||||||
|---|---|---|---|---|---|---|
| Variable | Before | After | After - Before | SE | p-value | Std. diff. |
| Tariffs Harmful - Totally Agree | 0.424 | 0.467 | 0.043 | 0.007 | 0.000 | 0.086 |
| Tariffs Harmful - Tends to Agree | 0.418 | 0.396 | -0.022 | 0.006 | 0.001 | -0.044 |
| Tariffs Harmful - Tends to Disagree | 0.082 | 0.073 | -0.009 | 0.004 | 0.015 | -0.032 |
| Tariffs Harmful - Totally Disagree | 0.014 | 0.015 | 0.001 | 0.002 | 0.519 | 0.009 |
| Tariffs Harmful - Don't Know | 0.063 | 0.049 | -0.014 | 0.003 | 0.000 | -0.059 |
| Note: Entries in the “Before” and “After” columns are survey-weighted proportions choosing each response to the statement “Increasing customs tariffs harms the global economy.” “After − Before” is the difference between respondents interviewed after and before the Liberation Day announcement; “SE” and “p-value” refer to that difference, and “Std. diff.” is the standardized difference. | ||||||
The Impact of Liberation Day on Europeans’ Beliefs about Tariffs and Preferences about Trade Policy
Abstract
This paper analyzes how President Trump’s Liberation Day affected attitudes toward trade policy in the European Union. Comparing the attitude of respondents who were interviewed in the days before Liberation Day to the attitude of those interviewed in the days after, our preferred regression specification suggests that Liberation Day led to a 5.7 percentage points increase (from about 42 percent before Liberation Day) in the share of respondents who totally agreed that customs tariffs harm the global economy. At the same time, we find no statistically significant effects on support for a common EU trade policy, EU retaliatory tariffs, or greater rules-based cooperation. Thus, while a major real-world shock had a modest effect on beliefs about trade policy, it did not significantly shift policy preferences.
Keywords
Trade Policy, Attitudes, Liberation Day
1. Introduction
A substantial literature examines why citizens support or oppose particular trade policies (see Kuo and Naoi (2015) and Naoi (2020) for reviews). Much of this work uses survey data to link trade policy preferences to factors like material interests, education, gender, or sociotropic beliefs. Scheve and Slaughter (2001), for example, use National Election Studies survey data to show that home ownership and skill level are associated with support for trade barriers. Mayda and Rodrik (2005), using data from the International Social Survey Programme, find that trade policy preferences are correlated with individuals’ human capital, exposure to trade, social status, and values. Hainmueller and Hiscox (2006), drawing on three different surveys, argue that such preferences partly reflect exposure to economic ideas and information. Mansfield and Mutz (2009), using data from the National Annenberg Election Study, show that sociotropic perceptions (beliefs about how trade affects the country as a whole) as well as attitudes toward out-groups relate to views on trade policy.
However, causal inference from observational surveys is difficult. Individuals who oppose a specific trade policy may differ from supporters in many ways, making it challenging to identify which factors actually shape their opinions. In response, scholars have increasingly turned to survey experiments, in which researchers manipulate the information participants receive before eliciting their views on trade policy. Herrmann, Tetlock, and Diascro (2001) vary the identity of the foreign trade partner and the domestic distribution of gains from trade. Hiscox (2006) provides information about potential job losses, lower consumer prices, or economists’ support for openness. Rho and Tomz (2017) provide respondents with information identifying which groups would gain or lose from trade. Di Tella and Rodrik (2020) vary the source of labor-market shocks, comparing how demand for protectionism responds to job losses caused by technological change, demand shifts, poor management, and international outsourcing. Finally, Stantcheva (2022) uses information treatments that change respondents’ perceptions of the efficiency and distributional impact of trade.
Although survey experiments improve causal identification, it remains unclear whether their findings generalize to real-world political settings. Experimental treatments typically present respondents with discrete pieces of information in a controlled environment. Real-world events, by contrast, combine new information with heightened salience and strategic considerations. These differences matter because evidence that information changes attitudes in a survey does not necessarily imply that politically salient events will produce comparable changes outside the survey setting.
This paper examines this question using Trump’s “Liberation Day” tariff announcement as a naturally occurring information and salience shock. On April 2, 2025, President Trump announced a sweeping tariff package that included a 10 percent baseline tariff and additional country-specific “reciprocal” tariffs, including a 20 percent tariff on imports from the European Union. For Europeans, this announcement made the potential consequences of tariffs unusually visible: tariffs became an immediate and highly salient threat to both consumer prices and global trade.
To identify the impact of the Liberation Day announcement, we use an “unexpected event during survey” research design (Muñoz et al., 2019). Between March 25 and May 10, 2025, thousands of Europeans were interviewed as part of the EU’s regular Eurobarometer survey. The survey included several questions about respondents’ beliefs about tariffs and preferences concerning trade policy. By comparing respondents interviewed before the announcement with those interviewed after it, we estimate the causal effect of the announcement on those outcomes.1
This approach has been used by two other papers in the trade attitudes literature: Coupé and Shepotylo (2021) estimate the impact of President Trump’s election in 2016 on Europeans’ willingness to sign a trade and investment agreement with the United States. Mansfield and Solodoch (2024) use this design to estimate the impact of Trump’s announcement on June 15, 2018 of plans to impose tariffs on Chinese goods and the subsequent retaliation by China.2
The Eurobarometer survey offers two further advantages. First, the vast majority of survey experiments on trade attitudes focus on how respondents change their attitudes when given information about domestic factors. Analyzing how respondents react to other countries’ trade policies, as we do in this paper, is rare, however. An exception is Steinberg and Tan (2023), who find that support for trade protection among Chinese respondents doubles, from 13 percent to 26 percent, when respondents are told that “The United States has increased trade barriers such as tariffs on many foreign imports this year.” They also find that informing Argentine respondents that the United States had recently announced higher tariffs on Argentine goods reduces support for freer trade by 7.6 percentage points.
Second, the survey allows us to examine both respondents’ beliefs about the effects of tariffs and their trade policy preferences. Typical survey experiments alter respondents’ information and then measure changes in their policy preferences, but they rarely measure corresponding changes in beliefs about the effects of the policy. Two exceptions are She (2024) and Stantcheva (2022). Stantcheva (2022) finds that showing a video of how trade improves productivity has a significant effect on support for free trade, even though respondents’ perceptions of trade’s efficiency effects did not change. She (2024) finds that providing expert information about the impact of trade influences both beliefs about trade and trade policy preferences.
In contrast, we find that respondents who were interviewed after the Liberation Day announcement were about 5.7 percentage points more likely to select ‘Totally agree’ in response to the statement that ‘Increasing customs tariffs harms the global economy’. Thus, European respondents’ beliefs about the impact of customs tariffs changed modestly after Liberation Day. At the same time, we do not find that this increased agreement goes together with a statistically significant change in overall support for the EU imposing retaliatory tariffs, nor with an increase in support for more rules-based cooperation or a common EU trade policy.
Finally, we contribute to the literature on heterogeneity in responsiveness to information treatments, both in the context of trade (for example, She (2024) or Guisinger (2016)) and more generally (for example, Araujo, Gupta, and Vesterlund (2026)). We find little evidence that responsiveness differs by gender or political orientation, but some evidence that it varies by education level.
The remainder of this paper is organized as follows. We first discuss the nature of the Liberation Day announcement and its implications for the Eurobarometer respondents. We then describe the unexpected-event-during-survey design and apply it to four outcome variables. Next, we examine whether the impact of Liberation Day varies with respondents’ characteristics. The final section concludes.
2. The Liberation Day Announcement
That President Trump would increase tariffs came as little surprise. Tariff increases had been part of his election platform: in early 2023, he announced that ‘we will phase in a system of universal, baseline tariffs on most foreign products’ (Hains (2023)). This position was reaffirmed on inauguration day, January 20, 2025, when President Trump signed the “America First Trade Policy” memorandum directing agencies to investigate the causes of the United States’ trade deficit and “to recommend appropriate measures, such as a global supplemental tariff or other policies, to remedy such deficits” (The White House (2025a)). On February 1, 2025, President Trump then signed executive orders imposing an additional 25 percent tariff on imports from Canada and Mexico and an additional 10 percent tariff on Chinese imports (The White House (2025b)).
Europe also had been warned it could be a target: in December 2024, President Trump warned Europe it should buy more oil and gas from the United States because otherwise it would be “TARIFFS all the way” (Euractiv.com with Reuters (2024)). This threat was repeated immediately after the inauguration (Agence France-Presse (2025)) and made more specific by the end of February when President Trump announced European imports would soon be hit by a 25 percent tariff (RTÉ News (2025)). That Europe anticipated this is further shown by the fact that both the European Central Bank’s Consumer Expectations Survey and the Eurobarometer survey fielded questions related to the expected increase before Liberation Day.
On March 21, President Trump announced that “Liberation Day” would be April 2, 2025. On April 2, a two-tier tariff structure was announced: a baseline 10 percent tariff applied to imports from all countries, and additional tariffs for the countries with which the United States has the greatest trade deficits. The tariff for the EU was announced as 20 percent, which was not unexpected to EU policymakers (POLITICO (2025)).
While the tariffs themselves were not a surprise to those following the news closely, their global breadth and severity surprised many, including financial markets. Headlines on April 3 included “Worse than expected” (Yahoo Finance, Schafer (2025)), “Worse than worst-case scenario” (Al Jazeera, Power (2025)), “The dark days after the tariff apocalypse” (Financial Times, Financial Times (2025)), and “Trump Tariff News, April 3, 2025: Tariffs Send Dow to 1600-Point Decline, Dollar Slumps” (Wall Street Journal, The Wall Street Journal (2025)). A retrospective market note by J.P. Morgan (Faller and Cuevas (2025)) in October 2025 began: “Six months ago, President Donald Trump’s ‘Liberation Day’ tariffs hit like a shockwave. Overnight, United States duties surged from 2.5 percent to 25 percent – the biggest import tax hike in modern history and a gut punch to global supply chains. Economies braced. Investors panicked. ‘Recession’ dominated headlines.” Estimating the impact on stock markets in 67 countries, Kaczmarek et al. (2025) find that, over the three-day window following Liberation Day, stock indices fell on average by 7.16 percent in local-currency terms and by 7.57 percent in United States dollar terms. Similarly, the industry report by Allianz Research (Boata et al. (2025)) finds that the share of exporters who expected an increase in exports decreased by 40 percentage points immediately after Liberation Day.
Liberation Day, and the stock market fallout it triggered, made the economic consequences of tariffs clearly more visible to the wider public in the European Union as media coverage of tariffs increased dramatically.
Figure 1 shows the number of articles containing the word ‘tariffs’ in news sources from European Union countries included in the Factiva database between October 2024 and May 2025.3 Although attention to tariffs had already begun to increase beginning in February 2025, there was a clear peak in April, when the number of articles was 80 percent higher than in March.
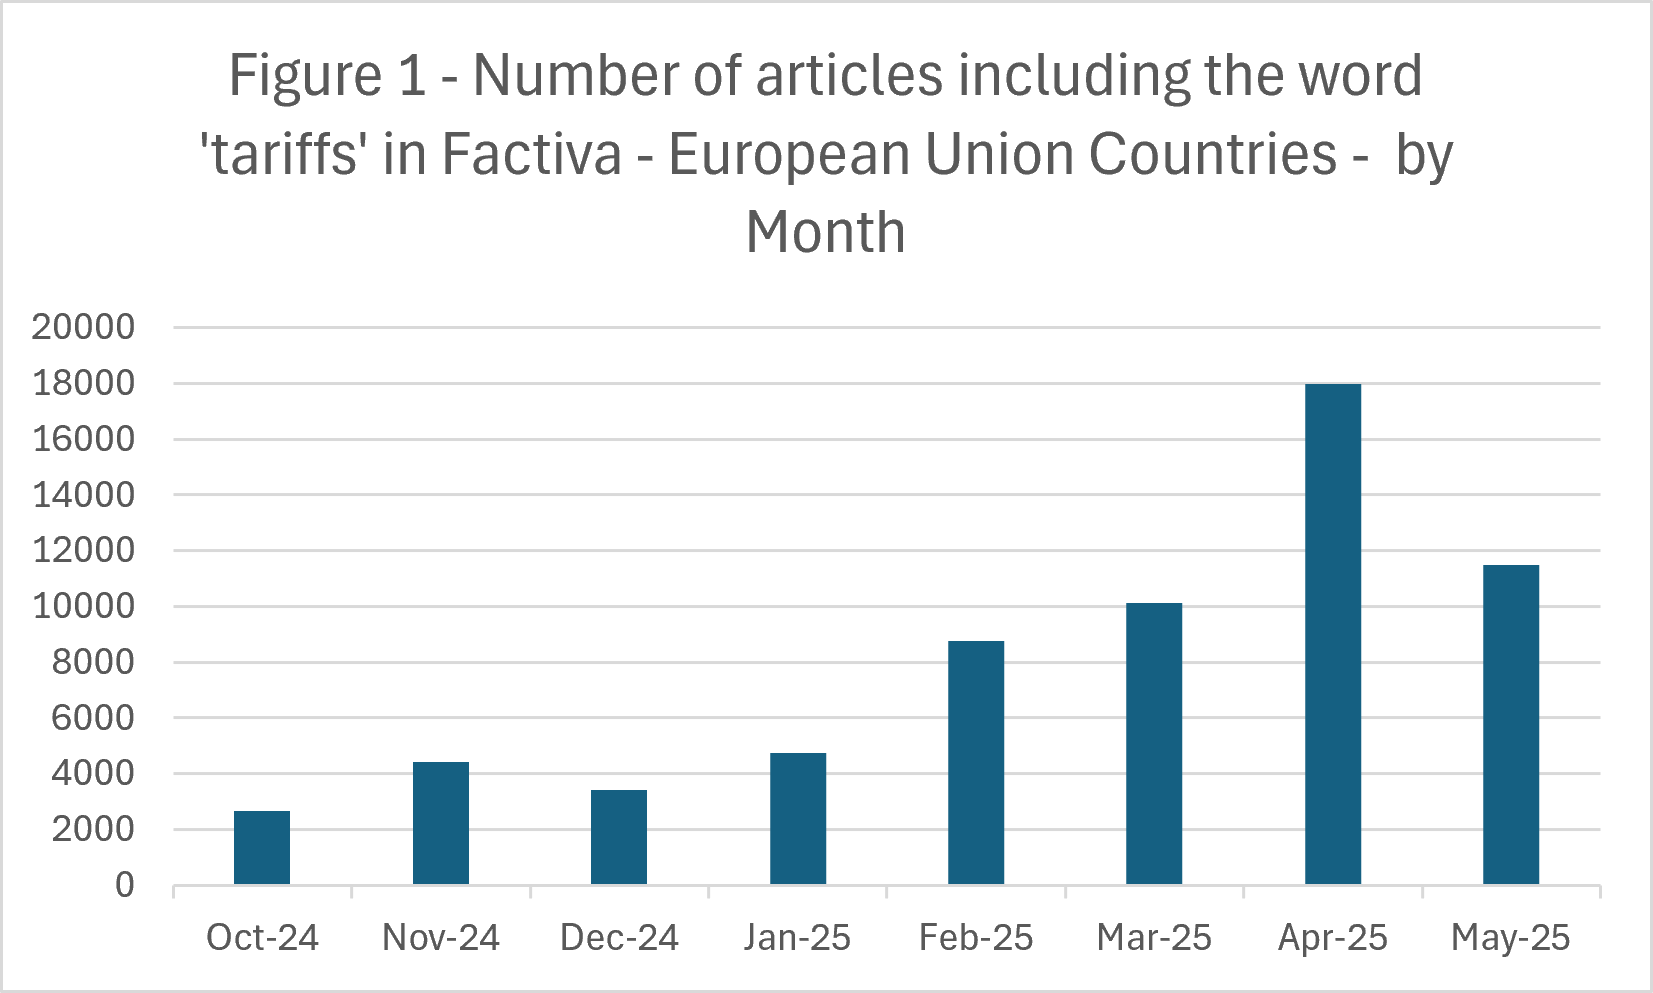
Figure 2 zooms in on the period of the Eurobarometer survey, and clearly shows that from April 3 onward the number of articles increased dramatically, with the week up to April 2 having fewer than half as many articles as the following week.
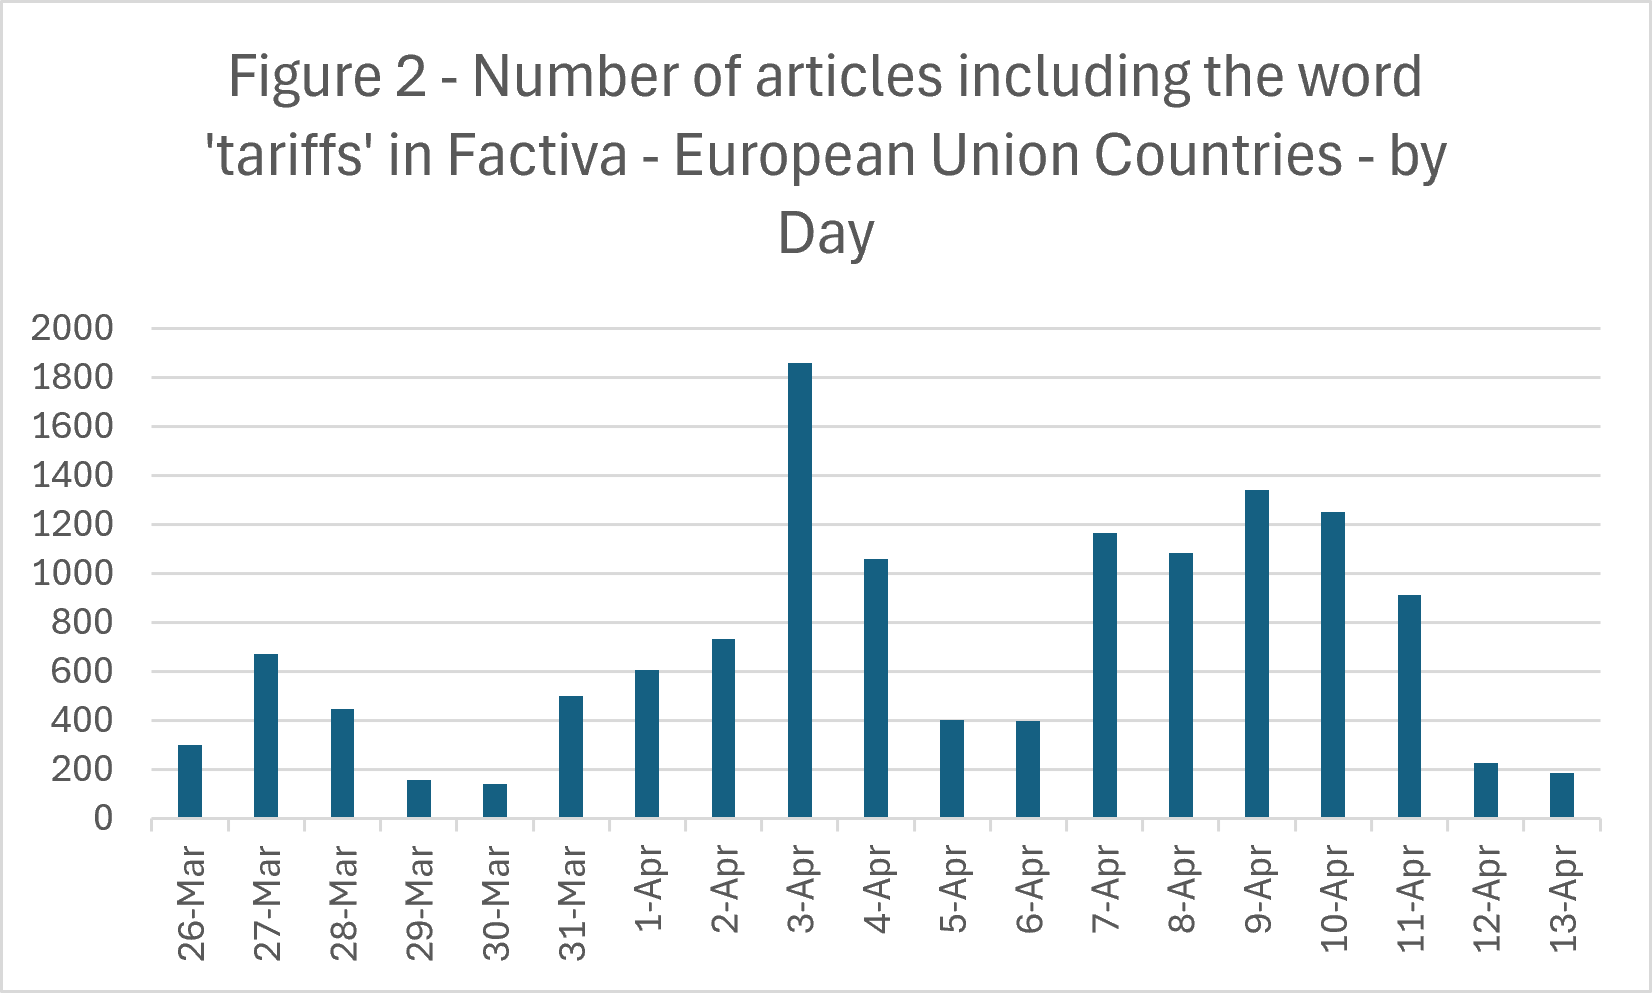
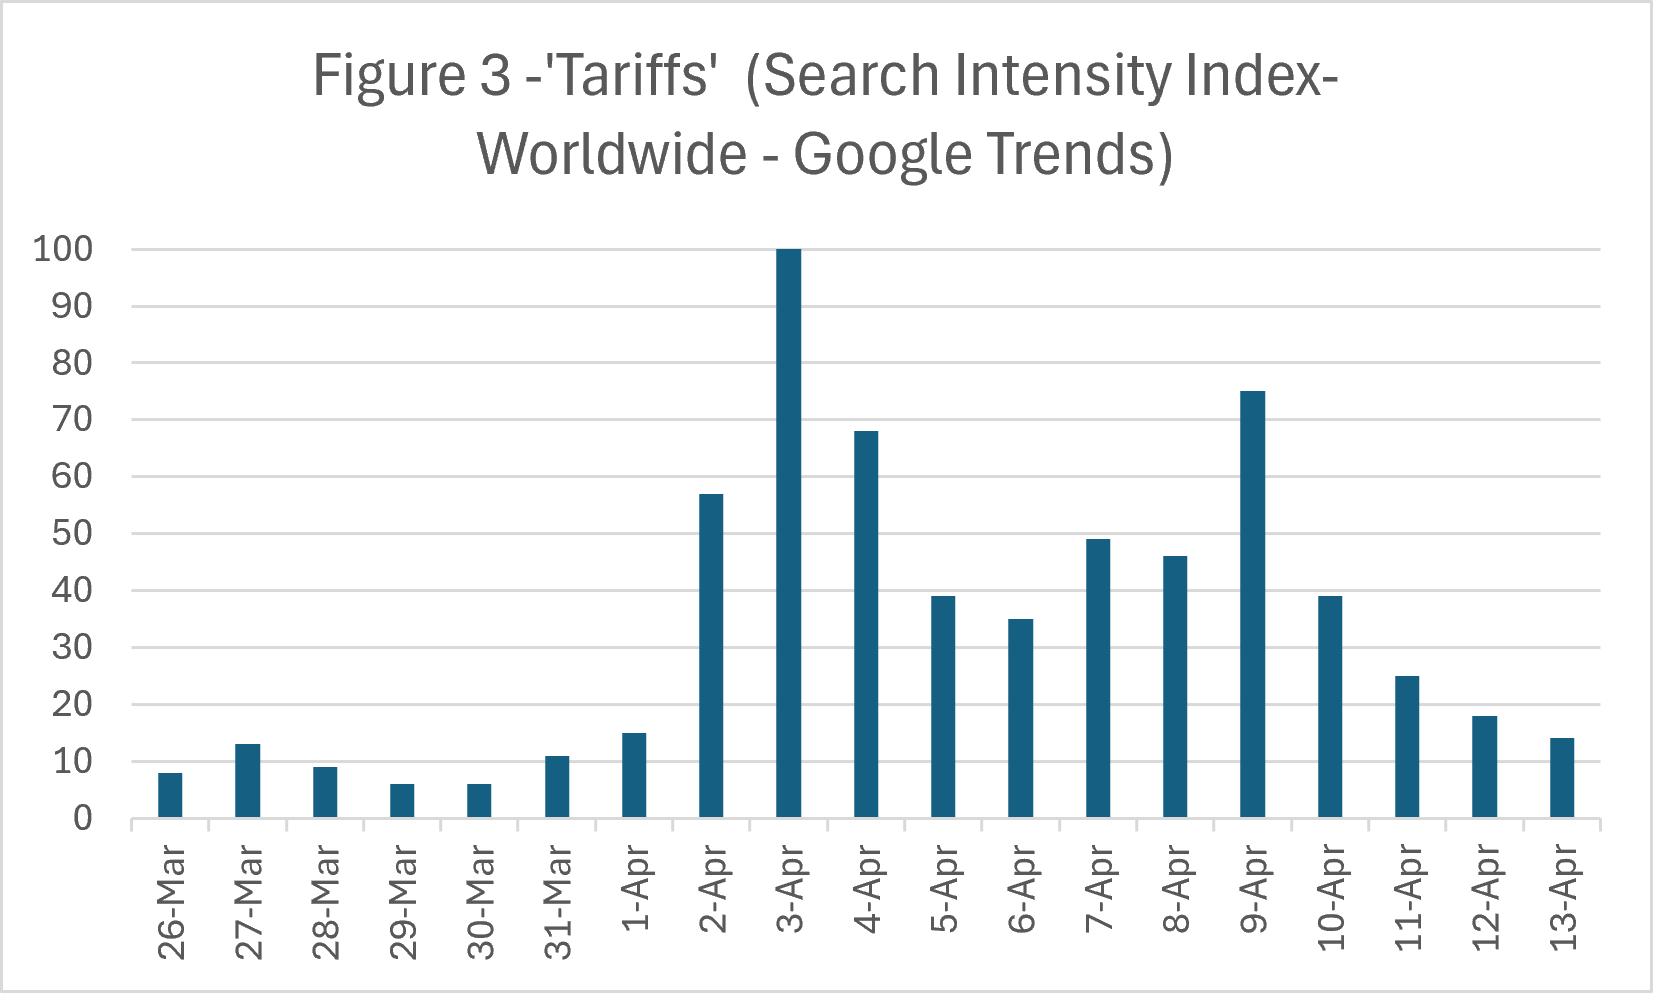
Figure 3 shows a similar shock in (worldwide) Google searches for the word ‘tariffs’.4
In summary, the existence of a United States tariff agenda was not itself unexpected. The shock we exploit is therefore not the initial revelation that tariffs would be imposed, but the severity, breadth, and salience of the April 2 announcement. Our estimand should be interpreted as the effect of a salient realization event: a sudden and widely covered confirmation that tariffs would be substantially more extensive than anticipated and, as reflected in the stock-market response, potentially more damaging to the economy. It should not be interpreted as the effect of first learning that tariffs were under consideration.
This treatment is closely related to experimental work on attitudes toward trade. In a survey experiment, Rho and Tomz (2017) ask United States respondents whether they support limiting imports. Some respondents are informed that such a policy “would hurt the U.S. economy and reduce the national standard of living.” Providing this information reduces support for protectionism. Similarly, in a survey experiment conducted in four European countries, Dotzauer and Meiners (2026) find that explicitly highlighting the high economic costs of trade restrictions lowers support for such policies.
There is, however, an important difference between these survey treatments and the real-world shock studied here. In survey experiments, all respondents assigned to treatment receive the relevant information. By contrast, a real-world information and salience shock is likely to be noticed and processed by only a subset of the population. Our estimates therefore capture the average effect of exposure to the post-announcement information environment, including imperfect attention and information uptake. This intention-to-treat effect is arguably the more policy-relevant quantity when evaluating interventions that operate through public communication or media coverage.
3. Data and Methodology
The Eurobarometer survey is a regular cross-national public opinion survey conducted on behalf of the European Commission to monitor attitudes, perceptions, and expectations across the European Union. It typically interviews around 1,000 respondents in each EU member state, with samples designed to be representative at the national level. Survey weights are provided to adjust for differences in sampling design and population size, allowing EU-wide estimates to be made.
This paper uses the Eurobarometer 103.3 survey, fielded in March - May 2025.5 The survey dataset includes information on the date and time of each interview. Treatment timing is defined relative to the tariff announcement at 4 p.m. United States Eastern Daylight Time on April 2, 2025. Respondents interviewed before the local announcement time on April 2 are classified as ‘before’, while those interviewed after the local announcement time are classified as ‘after’. The few respondents interviewed exactly at the announcement hour are excluded because their treatment status is ambiguous.
Our empirical strategy, comparing the answers of those interviewed before and after Liberation Day, assumes that, absent Liberation Day, respondents interviewed before and after the event would have been comparable in their underlying attitudes, so that any systematic difference between the two groups can be interpreted as the effect of Liberation Day rather than as a result of changes in sample composition. While we cannot test this assumption directly, we will do a balance check of several covariates and include them as controls in a regression analysis.
The dataset is further restricted to interviews conducted between seven days before and thirteen days after the announcement. This restriction excludes days with relatively few interviews and focuses the analysis on the period around the announcement, which strengthens the causal interpretation by reducing the likelihood that other events also influenced attitudes toward trade policy during the window. All included countries have at least 100 observations both before and after the announcement, and most have 400 or more observations both before and after the announcement.
We use four outcome variables, three of which come from the following question:
“For each of the following statements, please tell me whether you totally agree, tend to agree, tend to disagree or totally disagree.
Increasing customs tariffs harms the global economy
If other countries increase their duties on imports from the EU, the EU should impose customs tariffs in response to defend its interests (for example, by increasing duties on imports from those countries)
There should be more rules-based cooperation between countries and regions of the world”
Each outcome is coded as a binary indicator equal to 1 if the respondent ‘totally agrees’ with the relevant statement, and 0 if the respondent gives any other substantive response, including ‘don’t know’.
We focus on ‘totally agree’ responses because even before the Liberation Day announcement less than 12 percent of respondents disagreed with these statements (see below for details). The binary coding therefore captures movement into the strongest agreement category, rather than broader movement from disagreement to agreement.
The fourth outcome variable comes from the following question: What is your opinion on each of the following statements? Please tell me for each statement, whether you are for it or against it: the EU’s common trade policy. We code ‘For’ as 1, and ‘Against’ or ‘Don’t know’ as 0.
Given Liberation Day made the costs of tariffs more salient, we would expect respondents after Liberation Day to be more supportive of the statement that tariffs harm the global economy. This increased salience of the tariff costs could then increase the demand for rules-based cooperation and for EU trade cooperation, as a way to reduce the need for tariffs. Similarly, the salience of these costs could reduce the demand for retaliation, though for strategic reasons, the need to have a bargaining chip to be able to negotiate reduced tariffs with the US, might increase the demand for retaliation.6
We estimate the following weighted linear probability model separately for each outcome (k in {1,2,3,4}):
where
The dataset also includes demographic and socioeconomic variables which we use as controls
We further cluster standard errors at the country level and use survey weights to make the sample representative for the EU as a whole.
4. Data Analysis
4a. Impact on views on whether customs tariffs harm the global economy.
Table 1 shows the distribution of responses to the statement that “Increasing customs tariffs harms the global economy”. There is a shift towards ‘totally agree’, from about 42 percent of respondents in the days before Liberation Day, to about 47 percent of respondents in the days after Liberation Day. After Liberation Day, we see a decrease in the share of people answering ‘tend to agree’, ‘tend to disagree’ and ‘don’t know’. Hence, this suggests some people changed their beliefs while others strengthened their beliefs.
Figure 4 next focuses on the day-by-day evolution of the share of respondents totally agreeing, relative to April 2 (in the EU), the last day before Liberation Day.
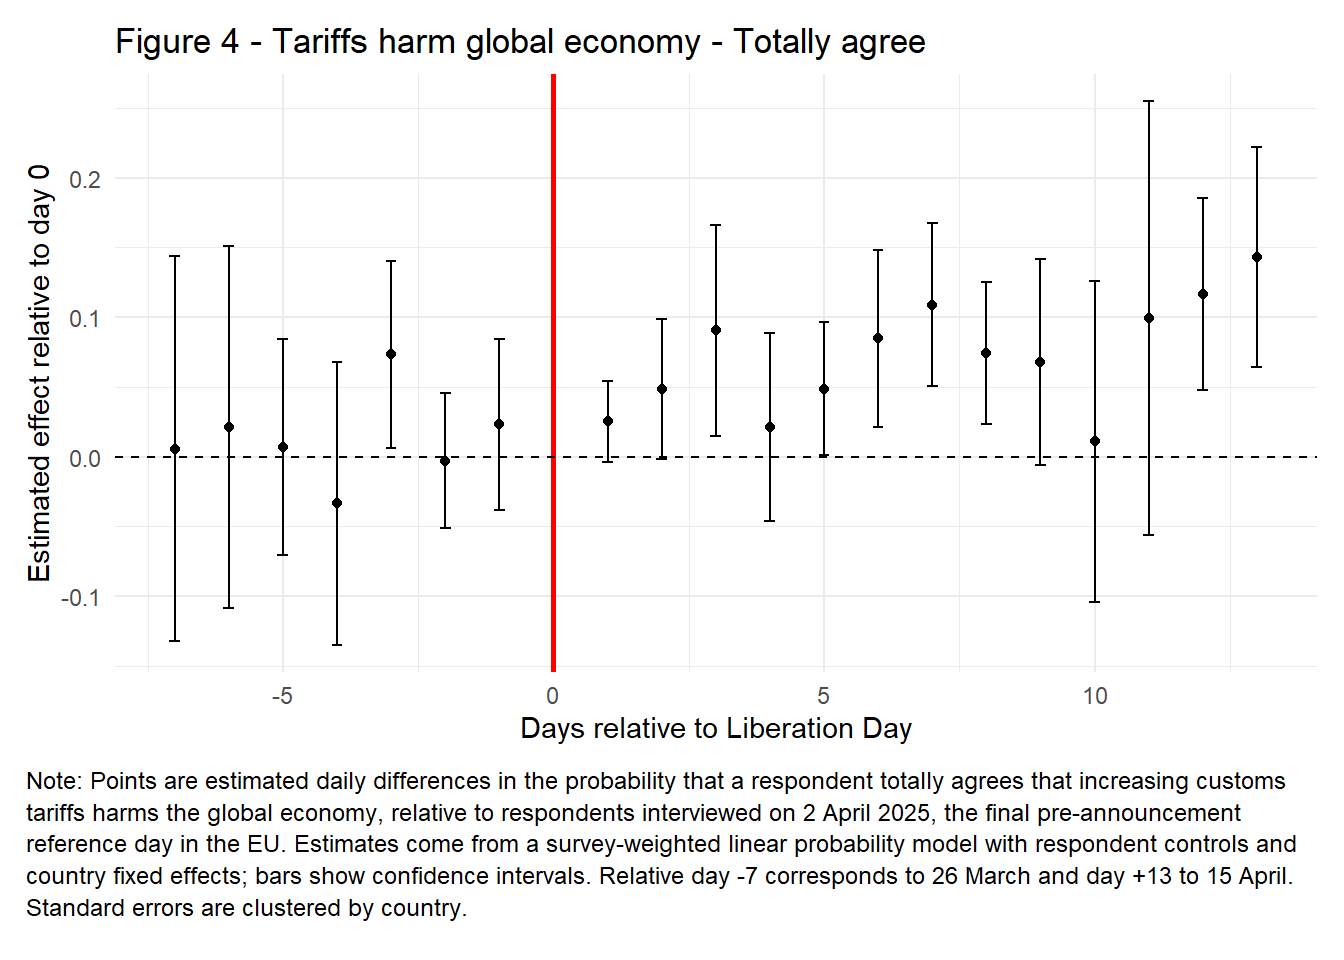
Figure 4 shows the results of a regression on the control variables and a dummy for each day of the survey, relative to the last day before Liberation Day (0 is April 2, 2025 in the EU, -7 is March 26, +13 is April 15). We plot the estimated effect of the dummies for the various days, which show how support on a given day differs from support on the last day before Liberation Day. The graph suggests there is an impact of Liberation Day, with the estimates before Liberation Day being closer to 0, and the estimates after Liberation Day being further away from 0.
To get an overall idea of the effect we next run the same regression but instead of including dummies for the various days, we include a dummy for the post announcement period. As robustness checks, we run the same regression without survey weights, and with an additional time trend (relative day).
| Table 2 - Effect of Liberation Day on Views about the harms of Tariffs | |||
|---|---|---|---|
| Weighted | No weights | Weighted + Control for Daily Trend | |
| Post | 0.057*** | 0.056*** | 0.030 |
| (0.014) | (0.009) | (0.018) | |
| Age | 0.002*** | 0.002*** | 0.002*** |
| (0.001) | (0.000) | (0.001) | |
| Female | -0.056*** | -0.056*** | -0.056*** |
| (0.011) | (0.011) | (0.011) | |
| Secondary Education | 0.101*** | 0.068* | 0.100*** |
| (0.021) | (0.034) | (0.021) | |
| Tertiary Education | 0.165*** | 0.130** | 0.165*** |
| (0.029) | (0.040) | (0.029) | |
| Small Town | -0.044 | -0.018 | -0.045 |
| (0.032) | (0.014) | (0.032) | |
| Large Town | -0.042 | -0.015 | -0.044 |
| (0.028) | (0.015) | (0.028) | |
| (Almost) Never Problems Paying Bills | 0.048+ | 0.064*** | 0.047+ |
| (0.025) | (0.014) | (0.025) | |
| Relative day | -0.000 | ||
| (0.009) | |||
| Relative day * Post | 0.005 | ||
| (0.009) | |||
| Num.Obs. | 26096 | 26096 | 26096 |
| R2 Adj. | 0.075 | 0.091 | 0.076 |
| + p < 0.1, * p < 0.05, ** p < 0.01, *** p < 0.001 | |||
| Note: The dependent variable equals 1 if the respondent totally agrees that increasing customs tariffs harms the global economy and 0 otherwise, including “Don’t know.” Entries are coefficients from linear probability models, with standard errors clustered by country in parentheses. “Post” equals 1 for interviews conducted after the local-time equivalent of the 2 April announcement. All models include age, gender, education, financial situation, type of locality, and country fixed effects. Column 1 uses survey weights, column 2 is unweighted, and column 3 adds a relative-day trend and its interaction with Post. | |||
Table 2 shows that after the announcement the respondents were 5.7 percentage points more likely to say they totally agree that customs tariffs harm the global economy.7 It further shows in the second column that using unweighted data we get very similar estimates. Finally, if we include a time trend, we see the trend is not significant and slightly negative before Liberation Day, but is positive (though insignificant) after Liberation Day, with immediate shock being about 3 percentage points (significant at the 10.2 percent significance level) . This is consistent with the graph above which also suggested that the time trend is mainly after Liberation Day, with little trend visible before Liberation Day.8
To check the assumption that respondents are similar before and after the Liberation Day, we provide descriptive statistics in Table 3.
| Table 3 - Balance Check | ||||||
|---|---|---|---|---|---|---|
| Weighted means for the regression sample | ||||||
| Variable | Before | After | After - Before | SE | p-value | Std. diff. |
| Age | 49.691 | 49.107 | -0.584 | 0.248 | 0.019 | -0.031 |
| Female | 0.514 | 0.514 | 0.000 | 0.007 | 0.983 | 0.000 |
| Secondary Education | 0.648 | 0.671 | 0.024 | 0.006 | 0.000 | 0.050 |
| Tertiary Education | 0.304 | 0.283 | -0.021 | 0.006 | 0.000 | -0.047 |
| Small Town | 0.406 | 0.443 | 0.037 | 0.007 | 0.000 | 0.075 |
| Large Town | 0.251 | 0.264 | 0.013 | 0.006 | 0.022 | 0.030 |
| (Almost) Never Problems Paying Bills | 0.642 | 0.641 | 0.000 | 0.006 | 0.966 | -0.001 |
| Observations | 9611.000 | 16485.000 | NA | NA | NA | NA |
| Note: The table compares survey-weighted covariate means for respondents interviewed before and after the Liberation Day announcement in the regression sample. For indicator variables, means are proportions. “After − Before” is the difference in means; “SE” and “p-value” refer to that difference, and “Std. diff.” is the standardized difference. | ||||||
Table 3 shows there are, on average, only small (standardized) differences between the respondents before and after the announcement in terms of age, being female and the probability of not having problems paying bills. The after sample is less likely to be living in rural areas and somewhat more likely having secondary education, however. That being said, the regression results that control for these observable differences, reported in Table 2, are very similar to the unadjusted descriptive differences, reported in Table 1. This suggests that the estimated effects are not very sensitive to adjustment for observed differences across interview timing, reducing the concern that these small imbalances drive the results.
So far we have shown that Liberation Day had a significant effect on Europeans’ belief about customs tariffs. While even before Liberation Day, about 42 percent of Europeans totally agreed that customs tariffs harm the global economy, this increased to about 47 percent after Liberation Day. While this increase is meaningful, it seems relatively modest compared to the amount of media attention the Liberation Day announcements generated. This could mean that the media attention did not reach all of the general public, consistent with Kertzer et al. (2025), who study the media consumption of Americans and find that most are exposed to relatively little news about trade. However, below we find that those not interested in politics (and hence less likely to follow the news) have a similar change in beliefs to those who are interested in politics.
Alternatively, the media attention reached everyone but failed to convince many. Survey experiments typically do not test how their information treatments affected beliefs about the impact of trade policy (rather than preferences about trade policy), but Stantcheva (2022) finds that showing a video of how trade affects efficiency (improving productivity) does not significantly change respondents’ perceptions of those effects. She (2024) also shows providing expert information has significant but relatively small effects on belief updating about the impact of trade.
4b. Impact on Support for Retaliatory Tariffs
Next we focus on whether Liberation Day changed the policy preferences of respondents. Many survey experiments in this literature find an effect of information on trade policy preferences. Even Stantcheva (2022), who does not find that information affects beliefs, still finds that videos that show trade improves productivity significantly affect support for free trade and for lower trade restrictions. She (2024) finds modest effects of information on beliefs, followed by modest effects on policy preferences.9
Table 4 shows that, even before Liberation Day, most European respondents tended to agree (43 percent) or totally agreed (38 percent) the EU should impose customs tariffs in response to defend its interests if other countries increase their duties on imports from the EU. After Liberation Day, the share of respondents in favor of retaliation decreases slightly.
| Table 4 - Opinion on Retaliatory Tariffs, before and after Liberation Day | ||||||
|---|---|---|---|---|---|---|
| Variable | Before | After | After - Before | SE | p-value | Std. diff. |
| Retaliation - Totally Agree | 0.377 | 0.362 | -0.015 | 0.006 | 0.016 | -0.032 |
| Retaliation - Tends to Agree | 0.432 | 0.436 | 0.004 | 0.007 | 0.527 | 0.008 |
| Retaliation - Tends to Disagree | 0.098 | 0.110 | 0.013 | 0.004 | 0.002 | 0.042 |
| Retaliation - Totally Disagree | 0.029 | 0.026 | -0.003 | 0.002 | 0.200 | -0.017 |
| Retaliation - Don't Know | 0.065 | 0.066 | 0.001 | 0.003 | 0.746 | 0.004 |
| Note: Entries in the “Before” and “After” columns are survey-weighted proportions choosing each response to the statement that the EU should impose customs tariffs in response when other countries increase duties on EU imports. “After − Before” is the difference between respondents interviewed after and before the Liberation Day announcement; “SE” and “p-value” refer to that difference, and “Std. diff.” is the standardized difference. | ||||||
Figure 5 shows the estimated coefficients of the daily dummies, reflecting how support for retaliatory tariffs has changed after Liberation Day. As before, we focus on the share of respondents that ‘totally agree’ with the statement about retaliatory tariffs. Interestingly, despite respondents being more likely to agree totally that customs tariffs harm the global economy, we do not find evidence that the share of respondents that totally agrees with retaliatory tariffs has changed in a statistically significant way.
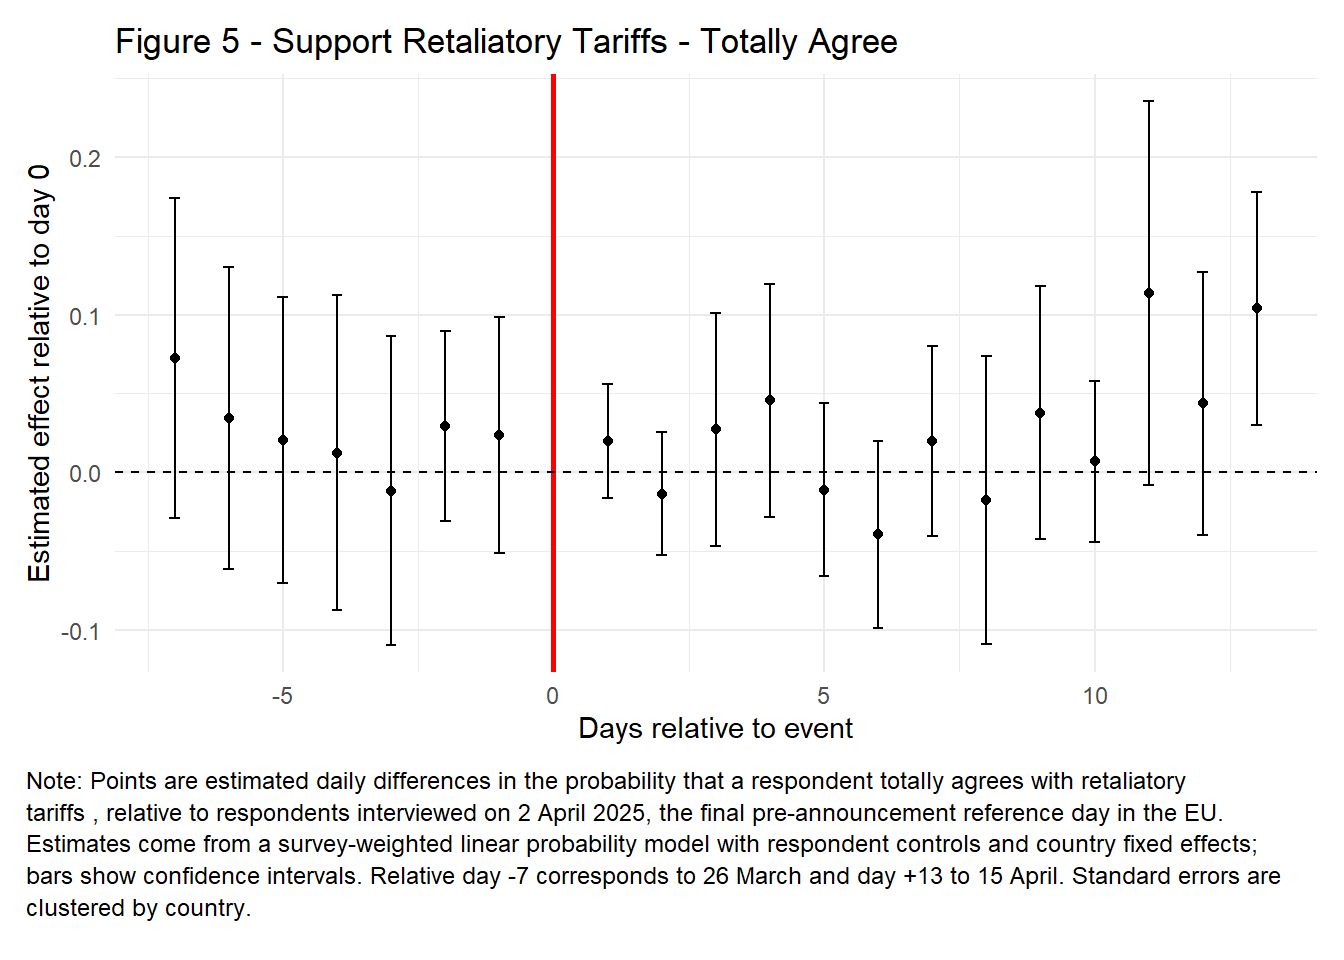
Table 5 confirms this and shows no statistically significant effects of Liberation Day on the share of respondents who totally support retaliatory tariffs, with point estimates close to 0. The wild-cluster bootstrap confidence interval for the Post dummy is [-0.0372, 0.0174] meaning even modest negative effects are unlikely.
As for control variables, female respondents and respondents with less education tend to be less in favor of retaliatory tariffs.
| Table 5 - Effect of Liberation Day Support for Retaliatory Tariffs | |||
|---|---|---|---|
| Weighted | No weights | Weighted + Control for Daily Trend | |
| Post | -0.008 | -0.003 | -0.014 |
| (0.012) | (0.011) | (0.014) | |
| Age | 0.001 | 0.001* | 0.001 |
| (0.000) | (0.000) | (0.000) | |
| Female | -0.041*** | -0.040*** | -0.041*** |
| (0.007) | (0.007) | (0.007) | |
| Secondary Education | 0.106*** | 0.062+ | 0.106*** |
| (0.027) | (0.034) | (0.027) | |
| Tertiary Education | 0.110*** | 0.068+ | 0.111*** |
| (0.030) | (0.039) | (0.030) | |
| Small Town | -0.016 | -0.007 | -0.017 |
| (0.016) | (0.012) | (0.016) | |
| Large Town | -0.001 | 0.010 | -0.003 |
| (0.022) | (0.021) | (0.022) | |
| (Almost) Never Problems Paying Bills | 0.012 | 0.039** | 0.011 |
| (0.010) | (0.013) | (0.010) | |
| Relative day | -0.004 | ||
| (0.007) | |||
| Relative day * Post | 0.007 | ||
| (0.008) | |||
| Num.Obs. | 26096 | 26096 | 26096 |
| R2 Adj. | 0.027 | 0.025 | 0.027 |
| + p < 0.1, * p < 0.05, ** p < 0.01, *** p < 0.001 | |||
| Note: The dependent variable equals 1 if the respondent totally agrees that the EU should impose retaliatory tariffs and 0 otherwise, including “Don’t know.” Entries are coefficients from linear probability models, with country-clustered standard errors in parentheses. All models include the baseline respondent controls and country fixed effects. Column 1 uses survey weights, column 2 is unweighted, and column 3 adds a relative-day trend and its interaction with Post. | |||
4c. Impact on Support for More rules-based cooperation
We next focus on a second policy preference, the preference for more rules-based cooperation. Table 6 shows most Europeans tend to agree (47 percent) or totally agree (42%) that there should be more rules-based cooperation between countries and regions of the world. Liberation Day does not seem to have changed that.
| Table 6 - Opinion on rules-based cooperation, before and after Liberation Day | ||||||
|---|---|---|---|---|---|---|
| Variable | Before | After | After - Before | SE | p-value | Std. diff. |
| More Cooperation - Totally Agree | 0.416 | 0.416 | 0.001 | 0.007 | 0.905 | 0.002 |
| More Cooperation - Tends to Agree | 0.465 | 0.465 | 0.000 | 0.007 | 0.957 | -0.001 |
| More Cooperation - Tends to Disagree | 0.065 | 0.066 | 0.001 | 0.003 | 0.849 | 0.003 |
| More Cooperation - Totally Disagree | 0.016 | 0.014 | -0.002 | 0.002 | 0.151 | -0.019 |
| More Cooperation - Don't Know | 0.038 | 0.039 | 0.001 | 0.003 | 0.634 | 0.006 |
| Note: Entries in the “Before” and “After” columns are survey-weighted proportions choosing each response to the statement that there should be more rules-based cooperation between countries and regions of the world. “After − Before” is the difference between respondents interviewed after and before the Liberation Day announcement; “SE” and “p-value” refer to that difference, and “Std. diff.” is the standardized difference. | ||||||
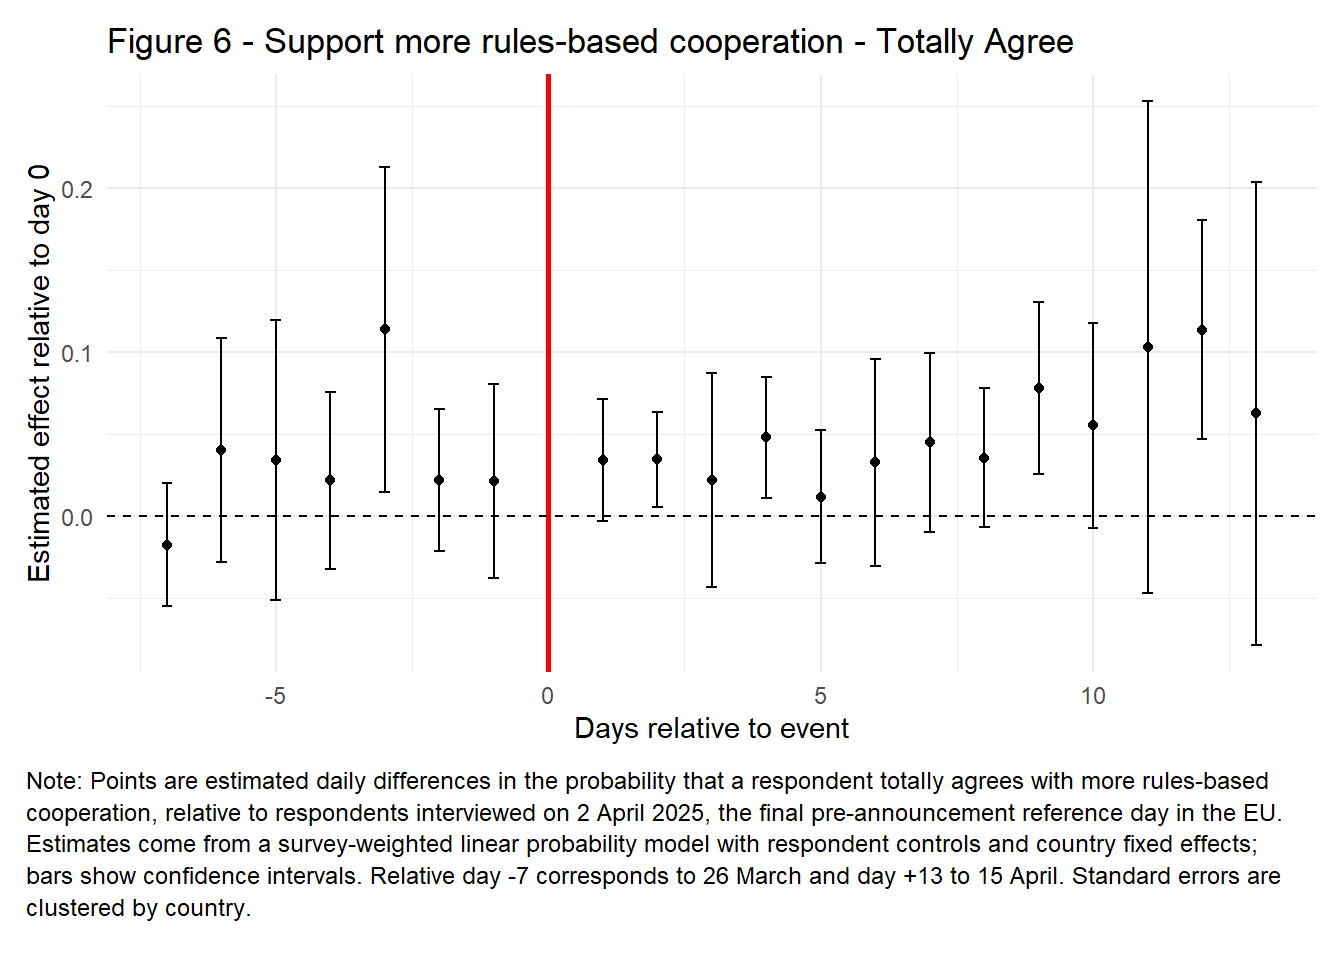
Figure 6 focuses on the share of respondents that totally agrees to support more rules-based cooperation, and also suggests not much changed after Liberation Day and the regression results in Table 7 further confirm this. The point estimates are around 2 percentage points, with the wild-cluster bootstrap confidence interval for the Post dummy being [-0.0189, 0.0533]. So while modest positive effects cannot be excluded, the point estimates on this preference question are only about a third of the point estimates of the beliefs question, despite similar baseline levels of support around 40 percent.
Note further that women and those with less education tend to be less likely to support more rules-based cooperation.
| Table 7 - Effect of Liberation Day on support for more rules-based cooperation | |||
|---|---|---|---|
| Weighted | No weights | Weighted + Control for Daily Trend | |
| Post | 0.018 | 0.022* | 0.001 |
| (0.015) | (0.009) | (0.012) | |
| Age | 0.000 | 0.001* | 0.000 |
| (0.000) | (0.000) | (0.000) | |
| Female | -0.027* | -0.038*** | -0.027* |
| (0.011) | (0.008) | (0.011) | |
| Secondary Education | 0.078* | 0.065* | 0.078* |
| (0.031) | (0.030) | (0.030) | |
| Tertiary Education | 0.143*** | 0.112*** | 0.143*** |
| (0.030) | (0.033) | (0.029) | |
| Small Town | -0.004 | 0.006 | -0.005 |
| (0.018) | (0.012) | (0.018) | |
| Large Town | 0.033 | 0.047** | 0.031 |
| (0.027) | (0.016) | (0.026) | |
| (Almost) Never Problems Paying Bills | 0.049** | 0.071*** | 0.049** |
| (0.017) | (0.014) | (0.017) | |
| Relative day | -0.004 | ||
| (0.005) | |||
| Relative day * Post | 0.008 | ||
| (0.005) | |||
| Num.Obs. | 26096 | 26096 | 26096 |
| R2 Adj. | 0.046 | 0.055 | 0.047 |
| + p < 0.1, * p < 0.05, ** p < 0.01, *** p < 0.001 | |||
| Note: The dependent variable equals 1 if the respondent totally agrees that there should be more rules-based cooperation between countries and regions and 0 otherwise, including “Don’t know.” Entries are coefficients from linear probability models, with country-clustered standard errors in parentheses. All models include the baseline respondent controls and country fixed effects. Column 1 uses survey weights, column 2 is unweighted, and column 3 adds a relative-day trend and its interaction with Post. | |||
4d. Impact on Support for a common EU Trade Policy
Table 8 shows that, before Liberation Day, about 76 percent of European respondents were in favor of a common EU trade policy. This seems to increase slightly after Liberation Day.
| Table 8 - Opinion on common EU Trade Policy, before and after Liberation Day | ||||||
|---|---|---|---|---|---|---|
| Variable | Before | After | After - Before | SE | p-value | Std. diff. |
| Common EU Trade Policy - In Favor | 0.764 | 0.770 | 0.006 | 0.006 | 0.313 | 0.013 |
| Common EU Trade Policy - Against | 0.185 | 0.180 | -0.005 | 0.005 | 0.292 | -0.014 |
| Common EU Trade Policy - Don't Know | 0.050 | 0.050 | 0.000 | 0.003 | 0.930 | -0.001 |
| Note: Entries in the “Before” and “After” columns are survey-weighted proportions responding “For,” “Against,” or “Don’t know” when asked about the EU’s common trade policy. “After − Before” is the difference between respondents interviewed after and before the Liberation Day announcement; “SE” and “p-value” refer to that difference, and “Std. diff.” is the standardized difference. | ||||||
Note the question on common EU trade policy had been asked before, in the September-October 2024 Eurobarometer survey. In that survey, 70 percent of EU respondents were in favor of a common EU trade policy, meaning there has been a modest increase in support of the common EU trade policy between the time around President Trump’s second election in November 2024 and Liberation Day.
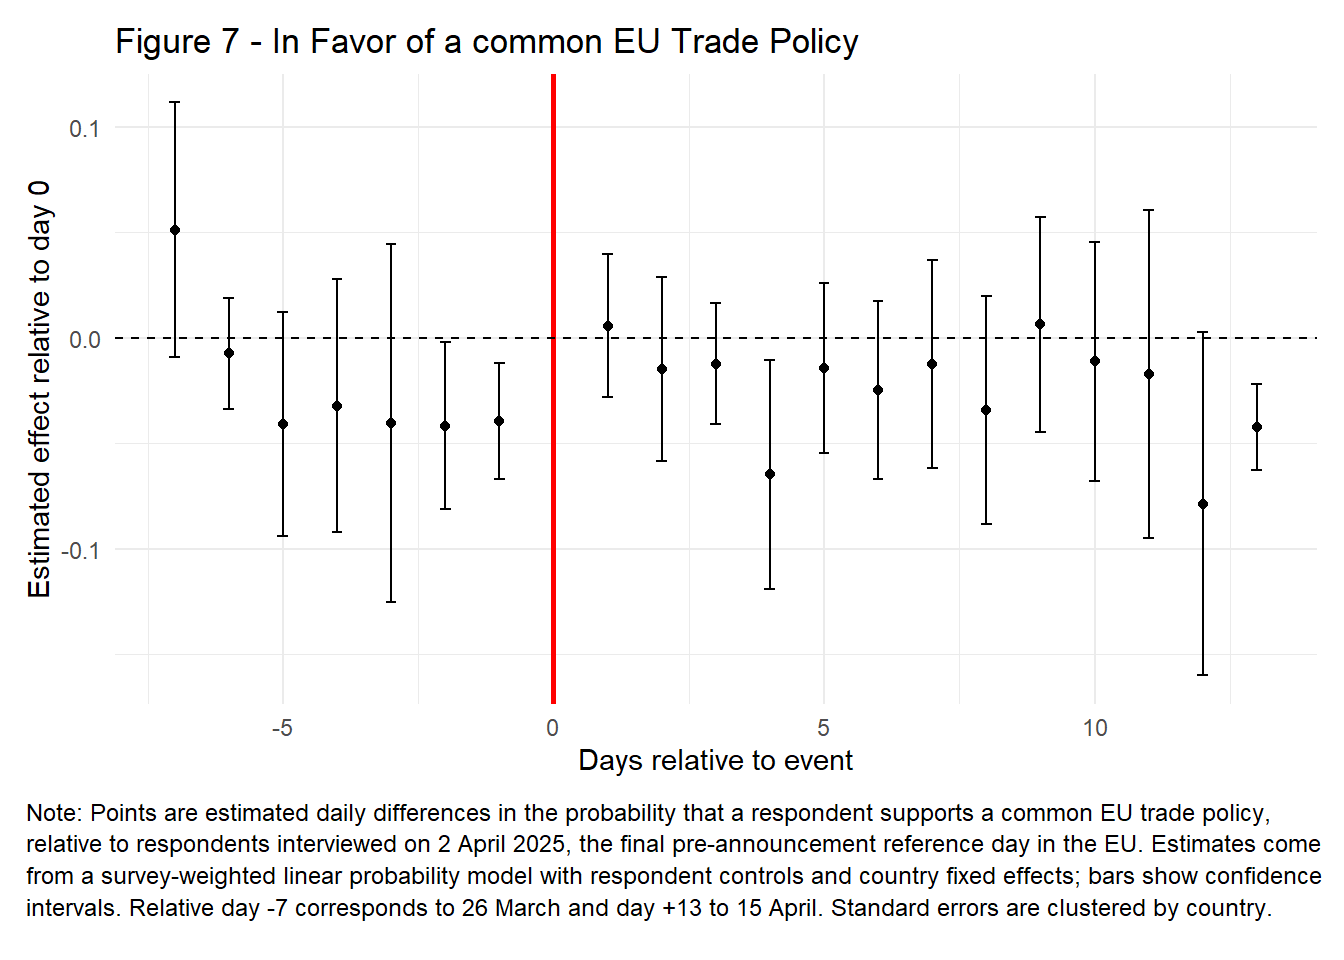
Figure 7 shows little change around Liberation Day in the support for a common EU trade policy, and this is confirmed in Table 9. The point estimates are close to 0 and the wild-cluster bootstrap confidence interval for the Post dummy is [-0.0198, 0.0318], meaning even modest positive effects like the ones we observed for ‘Tariffs are harmful’ (+5.7 percentage points) are again unlikely.
Support for the common EU trade policy is fairly similar across genders but more educated respondents are more likely to support the common EU trade policy than respondents with primary education or less.
| Table 9 - Effect of Liberation Day on Support for common EU Trade Policy | |||
|---|---|---|---|
| Weighted | No weights | Weighted + Control for Daily Trend | |
| Post | 0.005 | 0.004 | 0.019 |
| (0.010) | (0.009) | (0.021) | |
| Age | -0.001+ | -0.001+ | -0.001+ |
| (0.000) | (0.000) | (0.000) | |
| Female | -0.012+ | -0.022** | -0.012+ |
| (0.006) | (0.008) | (0.006) | |
| Secondary Education | 0.118*** | 0.071** | 0.118*** |
| (0.031) | (0.023) | (0.031) | |
| Tertiary Education | 0.173*** | 0.133*** | 0.173*** |
| (0.034) | (0.023) | (0.034) | |
| Small Town | 0.017 | -0.001 | 0.017 |
| (0.011) | (0.012) | (0.011) | |
| Large Town | 0.039* | 0.012 | 0.040* |
| (0.016) | (0.014) | (0.016) | |
| (Almost) Never Problems Paying Bills | 0.083*** | 0.080*** | 0.083*** |
| (0.017) | (0.013) | (0.017) | |
| Relative day | -0.001 | ||
| (0.004) | |||
| Relative day * Post | -0.001 | ||
| (0.005) | |||
| Num.Obs. | 26096 | 26096 | 26096 |
| R2 Adj. | 0.058 | 0.047 | 0.058 |
| + p < 0.1, * p < 0.05, ** p < 0.01, *** p < 0.001 | |||
| Note: The dependent variable equals 1 if the respondent is in favor of the EU’s common trade policy and 0 if the respondent is against it or answers “Don’t know.” Entries are coefficients from linear probability models, with country-clustered standard errors in parentheses. All models include the baseline respondent controls and country fixed effects. Column 1 uses survey weights, column 2 is unweighted, and column 3 adds a relative-day trend and its interaction with Post. | |||
Summarizing our findings so far, we find that Liberation Day caused a modest increase in the share of people who totally agree that customs tariffs harm the global economy. But we find much less evidence of a significant impact on the trade policy preferences of these same respondents.
This difference in results can be explained through various mechanisms. First, people may believe tariffs are harmful but still see retaliation as strategically necessary. Second, general beliefs about the global economy may be easier to update than established policy preferences, similar to Kuziemko et al. (2015) ’s finding that it is easier to change views about inequality than transfer policy preferences. Finally, policy preferences may reflect values, identity, reciprocity, security, or bargaining considerations, not merely economic beliefs.
4e. Heterogeneous Impacts
4e.1: Heterogeneous impact - harm the global economy
Since the above tables showed attitudes tend to differ by gender and educational level, we next run exploratory regressions by subsample, to see whether the impact of Liberation Day differs by educational and gender subgroups. This contributes to the literature on how people learn about trade (for example She (2024) or Guisinger (2016)) and the more general literature about the ‘female sensitivity hypothesis’ that women respond more to changes in treatment (Araujo, Gupta, and Vesterlund (2026)).
Table 10 shows that in terms of support for the statement that customs tariffs harm the global economy the reaction to Liberation Day did not differ by gender. This is consistent with Araujo, Gupta, and Vesterlund (2026) who find little evidence that gender predicts responsiveness to treatment in general, though in contrast to She (2024) who finds that women are significantly more responsive to expert information about the consequences of trade, and Guisinger (2016) who finds men are more responsive to information about the benefits of trade.
In terms of education, we find that the effect was largest for those with tertiary education but not statistically significant for those with primary education or less.10 This is consistent with She (2024) who finds that individuals with greater numeracy or trade knowledge are significantly more responsive to expert information about the consequences of trade.
| Table 10 - Effect of Liberation Day on support for harm the global economy, by subgroup | |||||
|---|---|---|---|---|---|
| Female | Not Female | Primary Education | Secondary Education | Tertiary Education | |
| Post | 0.049* | 0.065*** | 0.011 | 0.047*** | 0.084*** |
| (0.022) | (0.015) | (0.076) | (0.013) | (0.017) | |
| Num.Obs. | 13931 | 12165 | 1362 | 16047 | 8687 |
| R2 Adj. | 0.072 | 0.075 | 0.053 | 0.060 | 0.100 |
| + p < 0.1, * p < 0.05, ** p < 0.01, *** p < 0.001 | |||||
| Note: Each column reports the Post coefficient from a separate survey-weighted linear probability model estimated for the indicated gender or education subgroup. The dependent variable equals 1 if the respondent totally agrees that increasing customs tariffs harms the global economy and 0 otherwise. Models use the baseline respondent controls and country fixed effects, with standard errors clustered by country. | |||||
4e.2: Heterogeneous impact - Retaliation
Table 11 shows that in terms of support for retaliatory tariffs the reaction to Liberation Day did not differ by gender, but we find some evidence that Liberation Day made those with primary education or less less likely to support retaliation (the latter being inconsistent with She (2024)).
| Table 11 - Effect of Liberation Day on Support for Retaliatory tariffs, by Subgroup | |||||
|---|---|---|---|---|---|
| Female | Not Female | Primary Education | Secondary Education | Tertiary Education | |
| Post | -0.003 | -0.016 | -0.069* | -0.006 | -0.012 |
| (0.013) | (0.014) | (0.032) | (0.013) | (0.016) | |
| Num.Obs. | 13931 | 12165 | 1362 | 16047 | 8687 |
| R2 Adj. | 0.028 | 0.025 | 0.037 | 0.033 | 0.020 |
| + p < 0.1, * p < 0.05, ** p < 0.01, *** p < 0.001 | |||||
| Note: Each column reports the Post coefficient from a separate survey-weighted linear probability model estimated for the indicated gender or education subgroup. The dependent variable equals 1 if the respondent totally agrees that the EU should impose retaliatory tariffs and 0 otherwise. Models use the baseline respondent controls and country fixed effects, with standard errors clustered by country. | |||||
4e.3: Heterogeneous impact - rules-based cooperation
Table 12 shows that support for rules-based cooperation changed similarly across genders after Liberation Day, but we find some evidence that Liberation Day made those with tertiary education more likely to support rules-based cooperation (consistent with She (2024)).
| Table 12 - Effect of Liberation Day on Support for Rules- Based Cooperation by Subgroup | |||||
|---|---|---|---|---|---|
| Female | Not Female | Primary Education | Secondary Education | Tertiary Education | |
| Post | 0.026 | 0.010 | -0.017 | 0.007 | 0.045* |
| (0.025) | (0.022) | (0.030) | (0.017) | (0.021) | |
| Num.Obs. | 13931 | 12165 | 1362 | 16047 | 8687 |
| R2 Adj. | 0.040 | 0.053 | 0.059 | 0.041 | 0.042 |
| + p < 0.1, * p < 0.05, ** p < 0.01, *** p < 0.001 | |||||
| Note: Each column reports the Post coefficient from a separate survey-weighted linear probability model estimated for the indicated gender or education subgroup. The dependent variable equals 1 if the respondent totally agrees that there should be more rules-based cooperation between countries and regions and 0 otherwise. Models use the baseline respondent controls and country fixed effects, with standard errors clustered by country | |||||
4e.4: Heterogeneous impact - common EU Trade Policy
Table 13 finally shows little heterogeneity in terms of education or gender in terms of the impact of Liberation Day on support for a common EU trade policy.
| Table 13 - Effect of Liberation Day on Support for common EU Trade Policy by Subgroup | |||||
|---|---|---|---|---|---|
| Female | Not Female | Primary Education | Secondary Education | Tertiary Education | |
| Post | -0.009 | 0.020 | 0.056 | -0.001 | 0.012 |
| (0.017) | (0.012) | (0.043) | (0.014) | (0.014) | |
| Num.Obs. | 13931 | 12165 | 1362 | 16047 | 8687 |
| R2 Adj. | 0.061 | 0.056 | 0.063 | 0.048 | 0.047 |
| + p < 0.1, * p < 0.05, ** p < 0.01, *** p < 0.001 | |||||
| Note: Each column reports the Post coefficient from a separate survey-weighted linear probability model estimated for the indicated gender or education subgroup. The dependent variable equals 1 if the respondent is in favor of the EU’s common trade policy and 0 if the respondent is against it or answers “Don’t know.” Models use the baseline respondent controls and country fixed effects, with standard errors clustered by country. | |||||
Summarizing, we do find some evidence that reactions are heterogeneous in terms of the respondent’s education but not the respondent’s gender. Respondents with primary education (or less) decreased their support for retaliation, despite not changing their views on the harm of tariffs. Respondents with tertiary education changed their views on the harm of tariffs the most (+8.4 percentage points) and also became more supportive of rules-based cooperation (4.5 percentage points).
4e.5: Heterogeneity by country
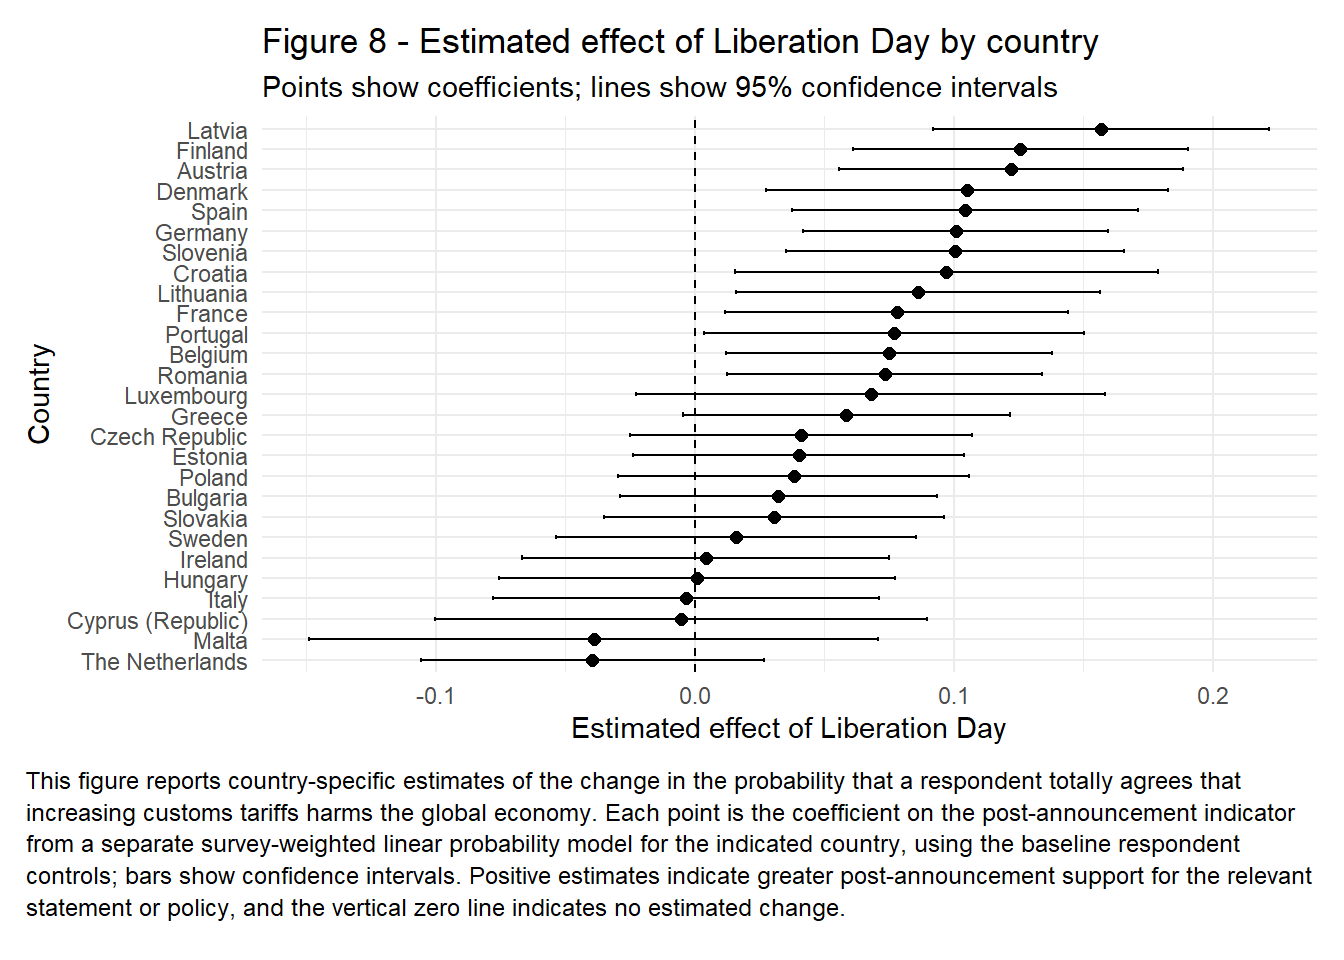
Next we run a separate regression for each country, to make sure our findings are not driven by a small group of countries.
For the ‘harm the global economy’ question, we find 23 (out of 27, see figure 8) positive estimates (13 of which are significantly positive at the 5 percent level), 4 negative estimates (none significantly so). This further strengthens the case for a causal effect of Liberation Day. For the other outcome measures we get a much more mixed picture, with positive and negative effects, confirming there is much less evidence for any consistent causal effect on these other measures.
4e.6: Heterogeneity by interest in politics and political orientation.
Thus far we included only clearly exogenous controls: age, gender, education, problems paying bills, and location are unlikely to be influenced by Liberation Day. We did not control for variables that potentially could be affected by Liberation Day, such as respondents’ political views or their interest in politics. In the Eurobarometer survey, respondents are asked to place themselves on a left (1) to right (10) scale. Eurobarometer then classifies those answering 1 to 4 as politically left, 5 and 6 as center, and 7 to 10 as politically right. Questions about how often respondents discuss politics are used by Eurobarometer to classify respondents on a 1 to 4 political interest scale. We create a political interest dummy that is 1 for those in the 2 top categories and zero for those in the 2 bottom categories. Below, we analyze what happens if we control for these variables.
Including these variables as controls does not change our conclusions in terms of the impact of Liberation Day on whether respondents totally agree that customs tariffs harm the global economy (Table 14). Respondents interested in politics are somewhat more likely to totally agree with the statement that customs tariffs are bad for the global economy (+3 percentage points), as are those on the political left (+2 percentage points).
| Table 14 - Effect of Liberation Day on views about the harms of tariffs, robustness check | |||
|---|---|---|---|
| Weighted | No weights | Weighted + Control for Daily Trend | |
| Post | 0.060*** | 0.056*** | 0.030 |
| (0.014) | (0.009) | (0.019) | |
| Age | 0.002** | 0.002*** | 0.002** |
| (0.001) | (0.000) | (0.001) | |
| Female | -0.051*** | -0.054*** | -0.051*** |
| (0.011) | (0.012) | (0.011) | |
| Secondary Education | 0.059+ | 0.051 | 0.057+ |
| (0.030) | (0.035) | (0.031) | |
| Tertiary Education | 0.120** | 0.113** | 0.120** |
| (0.037) | (0.040) | (0.038) | |
| Small Town | -0.049 | -0.019 | -0.050 |
| (0.032) | (0.014) | (0.032) | |
| Large Town | -0.051+ | -0.018 | -0.053+ |
| (0.030) | (0.015) | (0.030) | |
| (Almost) Never Problems Paying Bills | 0.043+ | 0.059*** | 0.042 |
| (0.026) | (0.014) | (0.026) | |
| Relative day | -0.002 | ||
| (0.009) | |||
| Relative day * Post | 0.008 | ||
| (0.009) | |||
| Politically Center | -0.022* | -0.009 | -0.023* |
| (0.010) | (0.011) | (0.010) | |
| Politically Right | -0.028* | -0.006 | -0.028* |
| (0.013) | (0.015) | (0.013) | |
| Politically Interested | 0.031* | 0.029* | 0.032* |
| (0.012) | (0.011) | (0.013) | |
| Num.Obs. | 22834 | 22834 | 22834 |
| R2 Adj. | 0.077 | 0.093 | 0.078 |
| + p < 0.1, * p < 0.05, ** p < 0.01, *** p < 0.001 | |||
| Note: The dependent variable equals 1 if the respondent totally agrees that increasing customs tariffs harms the global economy and 0 otherwise. This robustness specification adds political orientation and interest in politics to the baseline controls; politically left and not politically interested are the omitted categories. Entries are coefficients from linear probability models, with country-clustered standard errors in parentheses. Column 1 uses survey weights, column 2 is unweighted, and column 3 additionally controls for a relative-day trend and its interaction with Post. The smaller sample reflects missing values for the additional political variables. | |||
There does not seem to be much heterogeneity in the impact for subgroups based on these additional variables (Table 15). One could expect those interested in politics to be more likely to have followed the Liberation Day discussions, and hence to have been more likely to change their views. At the same time, they may also have been more likely to have changed their minds based on the pre-Liberation Day discussions. The impact for those interested in politics is estimated at 6.4 percentage points against 4.6 percentage points for those not interested in politics - both estimates are individually significant, but they are not significantly different from each other.Like She (2024), we also do not find that people with different political orientations update their beliefs differently.
| Table 15 - Effect of Liberation Day on support for harm the global economy, by subgroup, robustness check | |||||
|---|---|---|---|---|---|
| Interested in Politics | Not Interested in Politics | Politically Left | Politically Center | Politically Right | |
| Post | 0.064*** | 0.046* | 0.074*** | 0.044* | 0.072*** |
| (0.019) | (0.019) | (0.017) | (0.021) | (0.020) | |
| Age | 0.002* | 0.001* | 0.002*** | 0.002+ | 0.002*** |
| (0.001) | (0.001) | (0.000) | (0.001) | (0.000) | |
| Female | -0.055*** | -0.038+ | -0.102*** | -0.041*** | -0.014 |
| (0.013) | (0.020) | (0.019) | (0.010) | (0.018) | |
| (Almost) Never Problems Paying Bills | 0.044+ | 0.042 | 0.072* | -0.000 | 0.070 |
| (0.025) | (0.033) | (0.029) | (0.022) | (0.047) | |
| Politically Center | -0.010 | -0.051** | |||
| (0.015) | (0.018) | ||||
| Politically Right | -0.022+ | -0.047* | |||
| (0.013) | (0.022) | ||||
| Politically Interested | -0.002 | 0.058* | 0.032 | ||
| (0.015) | (0.025) | (0.030) | |||
| Num.Obs. | 16516 | 6318 | 6527 | 9489 | 6818 |
| R2 Adj. | 0.076 | 0.075 | 0.097 | 0.066 | 0.083 |
| + p < 0.1, * p < 0.05, ** p < 0.01, *** p < 0.001 | |||||
| Note: Each column reports estimates from a separate survey-weighted linear probability model for the indicated political-interest or political-orientation subgroup. The dependent variable equals 1 if the respondent totally agrees that increasing customs tariffs harms the global economy and 0 otherwise. Models include the applicable baseline controls and country fixed effects; the political-orientation models also control for interest in politics, while the political-interest models control for political orientation. Standard errors, clustered by country, are in parentheses. | |||||
5. Conclusions
This paper adds to the literature on individual attitudes towards trade policy in several ways. First, rather than analyzing how providing information in a survey experiment affects attitudes, we analyze how a major real-world shock to trade-policy information and salience affected individual attitudes. Second, we analyze how this shock affected both preferences about trade policy, and beliefs about the impact of trade policy, and show the impacts on beliefs and preferences can differ. Third, we show how the impact of the shock can differ across individuals.
Using the fact that Eurobarometer 103.3 was in the field in the days surrounding President Trump’s April 2 2025 “Liberation Day” announcement, we compare respondents interviewed just before the announcement with those interviewed just after. While tariffs themselves were anticipated, their breadth and size were not, triggering a stock-market sell-off and a sharp spike in media attention, making this a clean real-world information and salience shock.
We find that this major real-life shock changed beliefs only modestly: respondents were about 5.7 percentage points more likely to totally agree that customs tariffs harm the global economy after Liberation Day (from a base level of about 42%). We also find some heterogeneity, with respondents with tertiary education being statistically more responsive to the shock, but no statistically detectable heterogeneity in terms of political orientation or gender.
At the same time, we do not find evidence that overall policy preferences (support for a common EU policy, support for more rules-based cooperation and support for retaliatory tariffs) changed in a statistically significant way. While for one policy outcome (support for more rule-based cooperation), we cannot rule out policy effects comparable to the belief effects, our point estimates do suggest that even though some changed their beliefs about the impact of customs tariffs, substantially fewer changed their policy preferences.
The results presented in this paper thus show that even a large real-world information shock, that almost doubled media coverage of tariffs, moved trade policy beliefs and preferences in a very modest way. Given it is hard to imagine public information campaigns could stir similar media coverage, this suggests public information campaigns are unlikely to generate even modest changes in public opinion about trade.
References
Agence France-Presse. 2025. “Trump Says EU ‘in for Tariffs,’ Warns of 10% Rate on China.” Voice of America. https://www.voanews.com/a/7945671.html.
Araujo, Felipe, Neeraja Gupta, and Lise Vesterlund. 2026. “The Female Sensitivity Hypothesis: Evidence from Experimental Economics.” NBER Working Paper 35324. National Bureau of Economic Research. https://doi.org/10.3386/w35324.
Boata, Ana, Ano Kuhanathan, Lluis Dalmau, Jasmin Gröschl, Françoise Huang, and Maxime Lemerle. 2025. “Allianz Trade Global Survey 2025: Trade War, Trade Deals and Their Impacts on Companies.” Report. Munich: Allianz Research. https://www.allianz.com/content/dam/onemarketing/azcom/Allianz_com/economic-research/publications/specials/en/2025/may/2025-05-20-Trade-survey-AZ.pdf.
Coupé, Tom, and Oleksandr Shepotylo. 2021. “Popular Support for Trade Agreements and Partner Country Characteristics: Evidence from an Unexpected Election Outcome.” Economic Inquiry 59 (1): 549–66. https://doi.org/10.1111/ecin.12927.
Di Tella, Rafael, and Dani Rodrik. 2020. “Labour Market Shocks and the Demand for Trade Protection: Evidence from Online Surveys.” The Economic Journal 130 (628): 1008–30. https://doi.org/10.1093/ej/ueaa006.
Dotzauer, Marius, and Paul Meiners. 2026. “Enter the Trade War? European Public Opinion on Trade Restrictions Against China.” Review of International Political Economy 33 (3): 1420–50. https://doi.org/10.1080/09692290.2026.2631763.
Euractiv.com with Reuters. 2024. “Trump Wants EU to Buy More US Oil and Gas or Face Tariffs.” Euractiv. https://www.euractiv.com/news/trump-wants-eu-to-buy-more-us-oil-and-gas-or-face-tariffs/.
Faller, Madison, and Federico Cuevas. 2025. “‘Liberation Day’ in Retrospect: 6 Things That Surprised Investors.” Top Market Takeaways. J.P. Morgan. https://www.jpmorgan.com/insights/markets-and-economy/top-market-takeaways/tmt-liberation-day-in-retrospect-6-things-that-surprised-investors.
Financial Times. 2025. “The Dark Days After the Tariff Apocalypse.” https://www.ft.com/content/3a6c0561-0628-43e4-86f0-bd3db881667b.
Grahn, Michal, Katharina Lawall, Sophie Mainz, Maria Nordbrandt, and Stuart J. Turnbull-Dugarte. 2025. “A Game of Tariffs: Is There Demand for Tariffs in Europe?” Journal of European Public Policy. https://doi.org/10.1080/13501763.2025.2571062.
Guisinger, Alexandra. 2016. “Information, Gender, and Differences in Individual Preferences for Trade.” Journal of Women, Politics & Policy 37 (4): 538–61. https://doi.org/10.1080/1554477X.2016.1192428.
Hainmueller, Jens, and Michael J. Hiscox. 2006. “Learning to Love Globalization: Education and Individual Attitudes Toward International Trade.” International Organization 60 (2): 469–98. https://doi.org/10.1017/S0020818306060140.
Hains, Tim. 2023. “Trump ‘Agenda 47’ Campaign Platform: ‘Universal Baseline Tariffs’ to ‘Completely Eliminate Economic Dependence on China’.” https://www.realclearpolitics.com/video/2023/02/27/trump_agenda_47_campaign_platform_universal_baseline_tariffs_to_completely_eliminate_economic_dependence_on_china.html.
Herrmann, Richard K., Philip E. Tetlock, and Matthew N. Diascro. 2001. “How Americans Think about Trade: Reconciling Conflicts Among Money, Power, and Principles.” International Studies Quarterly 45 (2): 191–218. https://doi.org/10.1111/0020-8833.00189.
Hiscox, Michael J. 2006. “Through a Glass and Darkly: Attitudes Toward International Trade and the Curious Effects of Issue Framing.” International Organization 60 (3): 755–80. https://doi.org/10.1017/S0020818306060255.
Kaczmarek, Tomasz, Ender Demir, Wael Rouatbi, and Adam Zaremba. 2025. “Tariffs Announcement as a Global Stress Test: Early Stock Market Reactions to U.S. Protectionism.” Finance Research Letters 85: 108080. https://doi.org/10.1016/j.frl.2025.108080.
Kertzer, Joshua D., Pablo Barberá, Andrew Guess, Simon Munzert, JungHwan Yang, and Andi Zhou. 2025. “Trade Attitudes in the Wild,” October. https://jkertzer.sites.fas.harvard.edu/Research_files/Kertzer-IPES.pdf.
Kuo, Jason, and Megumi Naoi. 2015. “Individual Attitudes.” In The Oxford Handbook of the Political Economy of International Trade, edited by Lisa L. Martin, 99–117. Oxford: Oxford University Press.
Kuziemko, Ilyana, Michael I. Norton, Emmanuel Saez, and Stefanie Stantcheva. 2015. “How Elastic Are Preferences for Redistribution? Evidence from Randomized Survey Experiments.” American Economic Review 105 (4): 1478–508. https://doi.org/10.1257/aer.20130360.
Larsen, Erik Gahner. 2024. “Unexpected Events and Causal Inference.” Blog post. https://erikgahner.dk/2024/unexpected-events-and-causal-inference/.
Mansfield, Edward D., and Diana C. Mutz. 2009. “Support for Free Trade: Self-Interest, Sociotropic Politics, and Out-Group Anxiety.” International Organization 63 (3): 425–57. https://doi.org/10.1017/S0020818309090158.
Mansfield, Edward D., and Omer Solodoch. 2024. “Political Costs of Trade War Tariffs.” The Journal of Politics 86 (3): 1098–1103. https://doi.org/10.1086/729948.
Mayda, Anna Maria, and Dani Rodrik. 2005. “Why Are Some People (and Countries) More Protectionist Than Others?” European Economic Review 49 (6): 1393–1430. https://doi.org/10.1016/j.euroecorev.2004.01.002.
Naoi, Megumi. 2020. “Survey Experiments in International Political Economy: What We (Don’t) Know about the Backlash Against Globalization.” Annual Review of Political Science 23 (1): 333–56. https://doi.org/10.1146/annurev-polisci-050317-063806.
POLITICO. 2025. “EU Expects Trump to Set Flat, Double-Digit Tariff on April 2.” POLITICO. https://www.politico.com/news/2025/03/26/eu-readying-for-flat-double-digit-tariff-on-april-2-00004836.
Power, John. 2025. “‘Worse Than Worst-Case Scenario’: Trump’s Tariffs Send Markets Reeling.” Al Jazeera. https://www.aljazeera.com/economy/2025/4/3/worse-than-worst-case-scenario-trumps-tariffs-send-markets-reeling.
Rho, Sungmin, and Michael Tomz. 2017. “Why Don’t Trade Preferences Reflect Economic Self-Interest?” International Organization 71 (S1): S85–108. https://doi.org/10.1017/S0020818316000394.
RTÉ News. 2025. “EU Vows Firm Response as Trump Signals 25% Tariffs Coming.” RTÉ. https://www.rte.ie/news/world/2025/0226/1499133-europe-tariff-trump/.
Schafer, Josh. 2025. “‘Worse Than Expected’: Wall Street Reacts to Trump’s ‘Liberation Day’ Tariff Surprise, Stocks Sink.” Yahoo Finance. https://finance.yahoo.com/news/worse-than-expected-wall-street-reacts-to-trumps-liberation-day-tariff-surprise-stocks-sink-222345902.html.
Scheve, Kenneth F., and Matthew J. Slaughter. 2001. “What Determines Individual Trade-Policy Preferences?” Journal of International Economics 54 (2): 267–92. https://doi.org/10.1016/S0022-1996(00)00094-5.
She, Hongyi. 2024. “Learning about Trade.” SSRN Working Paper 4803318. Social Science Research Network. https://doi.org/10.2139/ssrn.4803318.
Stantcheva, Stefanie. 2022. “Understanding of Trade.” NBER Working Paper, no. 30040. https://doi.org/10.3386/w30040.
Steinberg, David A., and Yeling Tan. 2023. “Public Responses to Foreign Protectionism: Evidence from the US-China Trade War.” The Review of International Organizations 18 (1): 145–67. https://doi.org/10.1007/s11558-022-09468-y.
The Wall Street Journal. 2025. “Trump Tariff News, April 3, 2025: Tariffs Send Dow to 1600-Point Decline, Dollar Slumps.” Live coverage. The Wall Street Journal. https://www.wsj.com/livecoverage/trump-tariffs-trade-war-stock-market-04-03-2025.
The White House. 2025a. “America First Trade Policy.” Presidential Memorandum. The White House. https://www.whitehouse.gov/presidential-actions/2025/01/america-first-trade-policy/.
———. 2025b. “Fact Sheet: President Donald Trump Imposes Tariffs on Imports from Canada, Mexico and China.” Fact Sheet. The White House. https://www.whitehouse.gov/fact-sheets/2025/02/fact-sheet-president-donald-j-trump-imposes-tariffs-on-imports-from-canada-mexico-and-china/.
Footnotes
Larsen (2024) identified 206 studies using unexpected or purportedly unexpected events to estimate causal effects with survey data.↩︎
An industry report by Allianz Research (Boata et al. (2025)) also compares results of two surveys of business attitudes, one a couple of weeks before Liberation Day and the other a couple of weeks after Liberation day.↩︎
Factiva (https://www.dowjones.com/business-intelligence/factiva/ ) aggregates content from various news sources (newspapers, magazines, etc.).↩︎
Google Trends does not allow to restrict the search intensity to EU-wide searches.↩︎
We downloaded version 1.0.0 from the GESIS data service: https://search.gesis.org/research_data/ZA9128?doi=10.4232/1.14782.↩︎
Grahn et al. (2025) do a conjoint experiment shortly after Liberation Day and find German and British respondents are less supportive of retaliatory tariffs than of alternative economic or protectionist policies.↩︎
Clustering at the country level with only 27 clusters can produce downward-biased standard errors. Using wild-cluster bootstrap gives a p-value of 0.005 and a t-statistic of 4.1. In what follows we use clustered standard errors in the tables but report the stricter wild-cluster bootstrap for the key statistics in the text. It is standard to compute wild-cluster bootstraps for single estimates, keeping everything else fixed.↩︎
An ordered probit regression where we exclude the don’t know option also suggests that, controlling for other factors, after Liberation Day the totally agree category increases by about 4.5 percentage points, with the increase coming from decreases in the tend to agree category (-2.5 percentage points), the tend to disagree category (-1.5 percentage points) and the totally disagree category (-0.5 percentage points).↩︎
“a 1% increase in individuals’ beliefs about the sector/education-specific economic benefits of reducing imports results in a 0.16% decrease in their support for more liberal trade policies” (She (2024)).↩︎
This difference between the impact on those with primary and tertiary education is statistically significant when doing a pooled regression with all estimates interacted with the education dummies.↩︎