I. Introduction.
There is a growing literature on the impact of experiencing war on life satisfaction ( see Coupé and Obrizan (2023) for a recent review). Interestingly, however, several papers in this literature come to opposite conclusions even though they use the same dataset, and the same variables to measure life satisfaction and war.
Using the 2010 wave of the Life in Transition Survey (LITSII), which covers over 30000 respondents from thirty five European and Central Asian countries, Kijewski (2020) finds that respondents who were physically injured, or had parents or grandparents physically injured or killed during World War II, have significantly lower levels of life satisfaction, measured on a scale between 1 and 10 (Table 4, −0.108, p<0.01, n=25618). In the paper’s abstract, Kijewski (2020) writes: “Our findings indicate that war experiences continue to be related to lower levels of life satisfaction even six decades after the end of the war”.
However, Ivlevs (2015), also using LITSII, the same war variable and the same life satisfaction variable (but restricting the sample to those less than 65 years old), finds a positive and significant effect (Table 2, 0.071, p<0.05, n=24070). Ivlevs (2015) explains this positive effect by referring to the happiness of having survived, to war increasing “feelings of shared purpose, solidarity, trust, friendship and national pride”, and to pride of having “someone in their family died as a ‘martyr’ or was fighting for a ‘good’ or ‘holy’ cause’” (p. 349).
Finally, Child and Nikolova (2020) restricts the LITSII sample to “15 countries which experienced significant disruption from World War II battle activity” and finds no significant effect of the same war variable on the same life satisfaction variable (Table 8, –0.006, p>0.1, n=9538).
Noteably, both Kijewski (2020) and Child and Nikolova (2020) (but not Ivlevs (2015)) include a second war-related variable, a dummy for whether the respondent, or any of his/her parents or grandparents were displaced during World War II, as a control variable. Both estimated this variable to have a positive and significant effect on life satisfaction (Table 4, 0.118, p<0.01, n=25618, and Table 8, 0.078, p<0.01, n=9538, respectively).
Besides these 3 studies, there are two other studies that use the same LITSII dataset but use slightly different measures of life satisfaction and/or war experience. Nikolova and Sanfey (2016) convert the 1 to 10 life satisfaction scale into a 1 to 5 scale, and merge both aspects (being displaced and/or injured/killed in the war) into one war experience variable, and find no significant effect (Table A1, 0.0241, p>0.1, n=25666). In addition, they use a second life satisfaction question included in LITS II, which is also on a 1 to 5 scale, and again find no significant effect (Table A1, 0.00630, p>0.1, n=25427). Using the latter question and the aggregated war variable, Djankov, Nikolova, and Zilinsky (2016) also find no effect (Table 5, −0.008, p>0.1, n=24836).
Table I gives an overview of the characteristics and findings of the five studies that use LITSII to estimate the relationship between World War II exposure and life satisfaction.
Warning: package 'gt' was built under R version 4.3.3
| Table I: Estimating the Impact of Experiencing World War II on Life Satisfaction |
|
Table Nr. |
Effect Size |
P value |
Sample Size |
Life Satisfaction Scale |
War Measures |
| Kijewski 2020 |
4 |
-0.108 |
p<0.01 |
25618 |
1-10 |
Injured/killed, Moved |
|---|
| Child and Nikolova 2020 |
8 |
-0.006 |
p>0.1 |
9538 |
1-10 |
Injured/killed, Moved |
|---|
| Ivlevs 2015 |
2 |
0.071 |
p<0.05 |
24070 |
1-10 |
Injured/killed |
|---|
| Nikolova and Sanfey 2016 (I) |
A1 |
0.0241 |
p>0.1 |
25666 |
1-5 |
Injured/killed OR Moved |
|---|
| Nikolova and Sanfey 2016 (II) |
A1 |
0.0063 |
p>0.1 |
25427 |
1-5 |
Injured/killed, OR Moved |
|---|
| Djankov et al. 2016 |
5 |
-0.008 |
p>0.1 |
24836 |
1-5 |
Injured/killed OR Moved |
|---|
Note that, while the above studies focus on how World War II affects happiness, none of them allowed for other, more recent and local wars, to affect happiness, even though questions about victimization and displacement related to these other wars are available in the LITSII survey. Moreover, Obrizan (2019), using the third wave of the Life in Transition Survey (LITSIII), regresses life satisfaction (a happy/not happy dummy) on these recent war experiences, and finds insignificant negative effects of having injured or killed household members, but significant negative effects of having been displaced by these more recent and local wars (Table 2, -0.063, p<0.01, n=18157). Interestingly, Obrizan (2019) does not allow for World War II experience to influence life satisfaction.
In this paper, we analyse possible reasons for the conflicting findings of these previosu studies. We start by replicating the results of table I. There is ample evidence of a replication crisis in the social sciences (see for example, Baker (2016) or Reed (2018)), with researchers being unable to reproduce the results of published papers when trying to repeat the analysis described in those papers. Replicating the five papers from Table I will allow us to eliminate the possibility that the opposing findings are due to coding errors or typos in the published papers.
We then do perform specification curve analysis. The studies from Table I taken together make a ‘real-life’ ‘many analysts project’. In a ‘many analysts project’ (see, for example, Huntington-Klein et al. (2021), or in the context of life satisfaction, Hoogeveen et al. (2021)), a researcher provides a large number of analysts with the same dataset and research question, and then investigates how their conclusions differ. Typically, such projects document substantial differences in methodological choices and in some cases, substantial differences in conclusions. To show the range of possible outcomes (and avoid conflicting papers to be published), Simonsohn, Joseph, and Nelson (2021) propose specification curve analysis, which consists of conducting joint inference across all ‘theoretically relevant’ and ‘statistically valid’ specifications. In this paper, we use the specifications proposed by the five papers as the starting point of a specification curve analysis, allowing us to assess the degree of model uncertainty; that is, to what extent different specification choices lead to different estimates and conclusions.
Finally, we will analyse to what extent the conclusions of the studies of Table I are stable over time, by using the most recent, third, wave of the Life in Transition Survey and re-estimating the specifications of the five original studies. Together, the replication, the specification curve analysis and the updated analysis will allow us to assess how strong the evidence, that the Life in Transition Survey can provide, is about the long-term impact of war on life satisfaction.
Admittedly, it is difficult to obtain causal evidence based on non-experimental survey data like LITS, as the ‘treatment’ variable is not randomized. At the same time, it is hard to see how one could ethically run an experiment to measure the long-term effect of experiencing war on life satisfaction. While this means the ‘strongest support for the causation hypothesis’ is out of reach, we can analyse how well the research on the impact of war on life satisfaction scores on some of the other Bradford-Hill criteria (Bradford-Hill (1965)) such as consistency - that is, has the effect ‘been repeatedly observed by different persons, in different places, circumstances and times?’ - or the ‘strength of the association’. Note that within the constraints of using non-experimental data, LITS has several important advantages. The survey is large, with tens of thousands of respondents, and has been implemented in both 2010 (LITSII) and 2016 (LITSIII). It allows to measure life satisfaction in different ways based on two separate survey questions. Finally, while few large-scale surveys ask about war experiences, LITS has five questions related to war experience. Hence, LITS is one of the best available sources to estimate the long-term impact of war on life satisfaction.
The remainder of the paper is structured as follows. Section II replicates the five papers that provide estimates of the impact of World War II on life satisfaction. Section III provides a specification curve analysis focusing on the impact of having been physically injured, or having parents or grandparents who were physically injured or killed during World War II. Section IV focuses on the impact of having been displaced during World War II and of having been affected by more recent wars. Section V analyses the same questions but uses data from the third wave of LITS, while Section VI concludes.
II. Replicating the literature.
Given the evidence of a replication crisis in the social sciences (Baker (2016), Reed (2018)), we want to make sure the conflicting findings reported by various papers are not the results of typos in the published versions or errors in the computer codes used to generate these findings. We therefor replicate the key regressions of these papers by following the descriptions of the method, included variables and construction of the variables, provided in the papers.
Table II shows, for each study, the published effect size of the impact of experiencing injury/death during World War II, the p-value and sample size (columns I to III), followed by the effect size, p-value and sample size we get when we replicate these papers’ key regressions.
| Table II: Replicating the Literature |
|
Original Effect Size |
Original P value |
Original Sample Size |
Replication Effect Size |
Replication P value |
Replication Sample Size |
| Kijewski 2020 |
-0.108 |
p<0.01 |
25618 |
-0.099 |
p<0.01 |
25228 |
|---|
| Childs and Nikolova 2020 |
-0.006 |
p>0.1 |
9538 |
-0.052 |
p>0.1 |
9460 |
|---|
| Ivlevs 2015 |
0.071 |
p<0.05 |
24070 |
0.054 |
p>0.1 |
22144 |
|---|
| Nikolova and Sanfey 2016 (I) |
0.0241 |
p>0.1 |
25666 |
0.021 |
p>0.1 |
26069 |
|---|
| Nikolova and Sanfey 2016 (II) |
0.0063 |
p>0.1 |
25427 |
0.006 |
p>0.1 |
25823 |
|---|
| Djankov et al. 2016 |
-0.008 |
p>0.1 |
24836 |
-0.006 |
p>0.1 |
25505 |
|---|
Table II shows that the replicated results for Kijewski (2020), Nikolova and Sanfey (2016) and Djankov, Nikolova, and Zilinsky (2016) are almost identical to the published results. There are a couple of minor exceptions: like Child and Nikolova (2020), we find an insignificant effect, but the replicated effect size is considerably more negative. Like Ivlevs (2015), we find a positive estimate. However, unlike Ivlevs (2015), who found statistical significance at the 5% level, we only find the estimated effect to be significant at the 11% significance level.
Overall, we successfully replicate the literature estimating the impact of experiencing World War II on life satisfaction, finding a negative estimate when the original authors find a negative estimate and a positive estimate when the original authors find a positive estimate. In terms of statistical significance, we also come to the same conclusion as the original authors, except for Ivlevs (2015) for which we find slightly weaker evidence that the effect is significantly positive.
III. A Specification Curve Analysis.
To further explore the reasons why different authors find different estimates, we conduct a specification curve or multiverse analysis (Simonsohn, Joseph, and Nelson (2021), Steegen et al. (2016)).
The papers we replicated all use the same dataset. However, the authors use this same dataset in many ways. As explained in the introduction, there are differences in what measure of life satisfaction gets selected (1-5 scale versus 1-10 scale) and in how the war variable gets included (only the variable reflecting injuries/death included, the displacement-by-war variable also included, or both variables aggregated into one single measure of war experience).
Some of the control variables are common to all studies. All studies include variables capturing the age, gender, employment status, marital status, and health status of the respondent. They also include measures of the education of the respondent and the respondent’s father. All but Kijewski (2020) include income as a control variable. However, there are small differences in how authors include these variables: for example, some include dummies for all categories of education while others aggregate educational attainment into wider categories.
Besides the common set of control variables, there are many idiosyncratic variable choices. Kijewski (2020) controls for occupation, and religious and civic involvement. Child and Nikolova (2020) controls for mother’s education, whether the respondent or family members had been members of the communist party, whether the respondent had ever moved, and for rural/urban differences. Ivlevs (2015) controls for minority status, rural/urban/metropolitan status, whether there are children in the household, the presence of a migration network, differences in assets and differences in financial satisfaction.
The authors also chose different ways to capture geographic differences. Some include country fixed effects (Ivlevs (2015), Nikolova and Sanfey (2016)), others include in-country region-specific fixed effects (Child and Nikolova (2020)) while yet others include country random effects in addition to country-level characteristics like unemployment or per capita GDP (Kijewski (2020)), or just country-level characteristics such as whether the country was a transition country (Djankov, Nikolova, and Zilinsky (2016)).
Studies differ on whether they cluster standard errors and in whether or not they weigh observations. Kijewski (2020) does not cluster standard errors nor uses survey weights. All others use within country population weights (which makes the sample representative for each country, but also gives each country equal weight overall) and cluster standard errors at the level of country, region, or locality.
Finally, studies differ in which observations they included: Ivlevs (2015) focuses on those who are less than 65 years old, Kijewski (2020) excludes Kosovo, while Child and Nikolova (2020) focus on 15 countries that were heavily affected by World War II.
To illustrate the impact of methodological differences, Simonsohn, Joseph, and Nelson (2021) suggest to start from the “set of theoretically justified, statistically valid, and non-redundant specifications”. In this study, we use the specifications chosen by the five papers as the starting point for our set. While not necessarily exhaustive, given the choices underlying these specifications have all been deemed acceptable by these authors, the referees who reviewed these papers and the editors who decided to accept these papers for publication, the specifications based on these choices all can be considered ‘reasonable’.
More specifically, we use the five weights, clustering, and fixed effect choices of the papers. We vary what dependent variable is used (1-5 scale versus 1-10 scale), and what sub-population is used (15 heavily affected countries only, only under 65-year-olds, or a combination of these two). We include the common control variables in all specifications but vary the set of additional controls: a set of income-related variables (income, satisfaction with one’s financial situation, a proxy for assets), a set of additional war experiences (moved during World War II, moved because of recent conflict, injured during recent conflict, injured/killed household members during recent conflict), a set of all remaining controls, and any combination of the aforementioned sets.
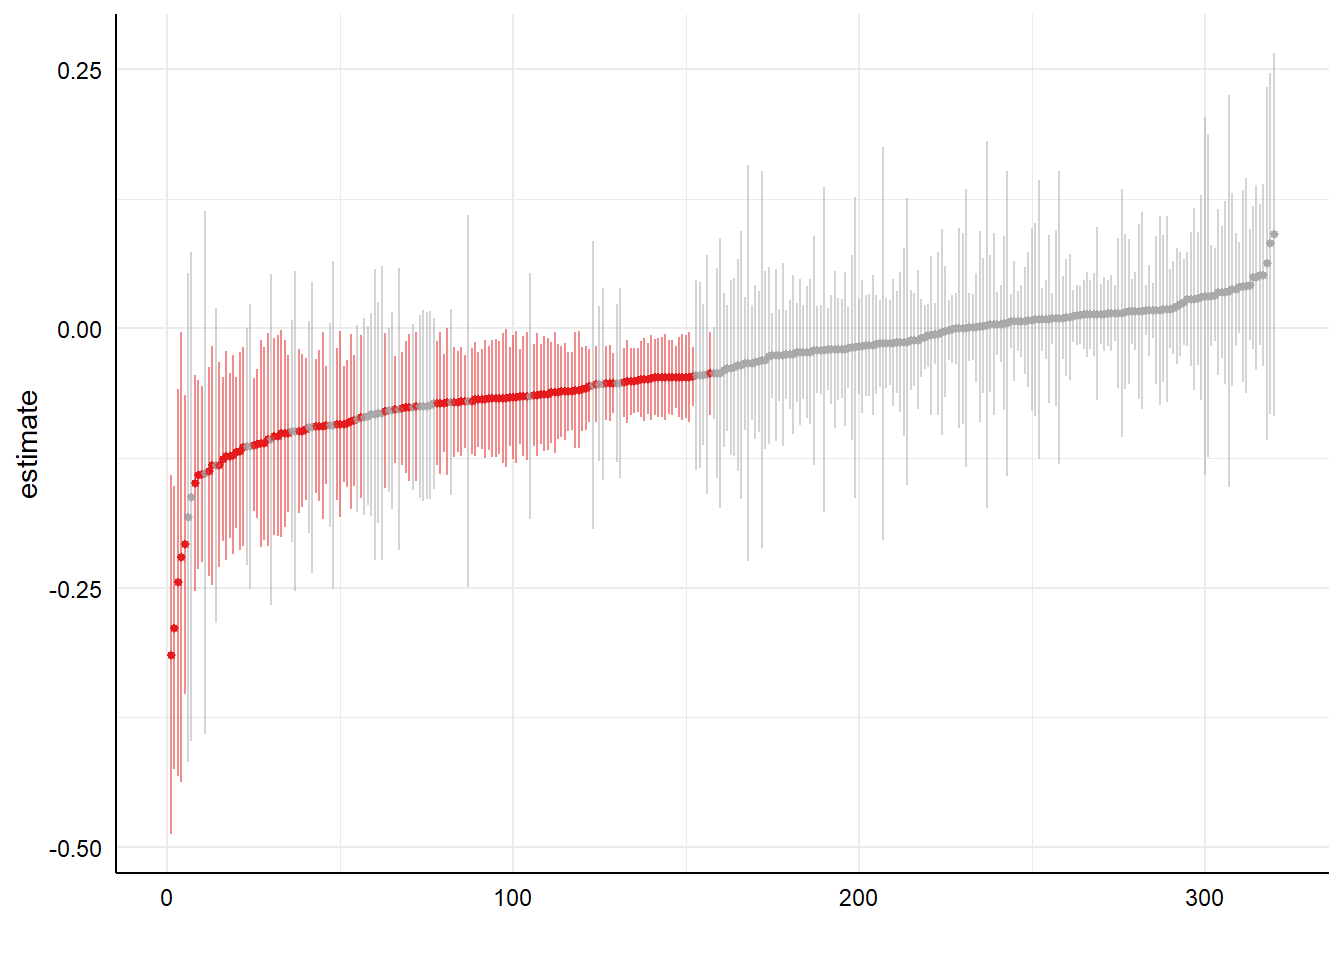
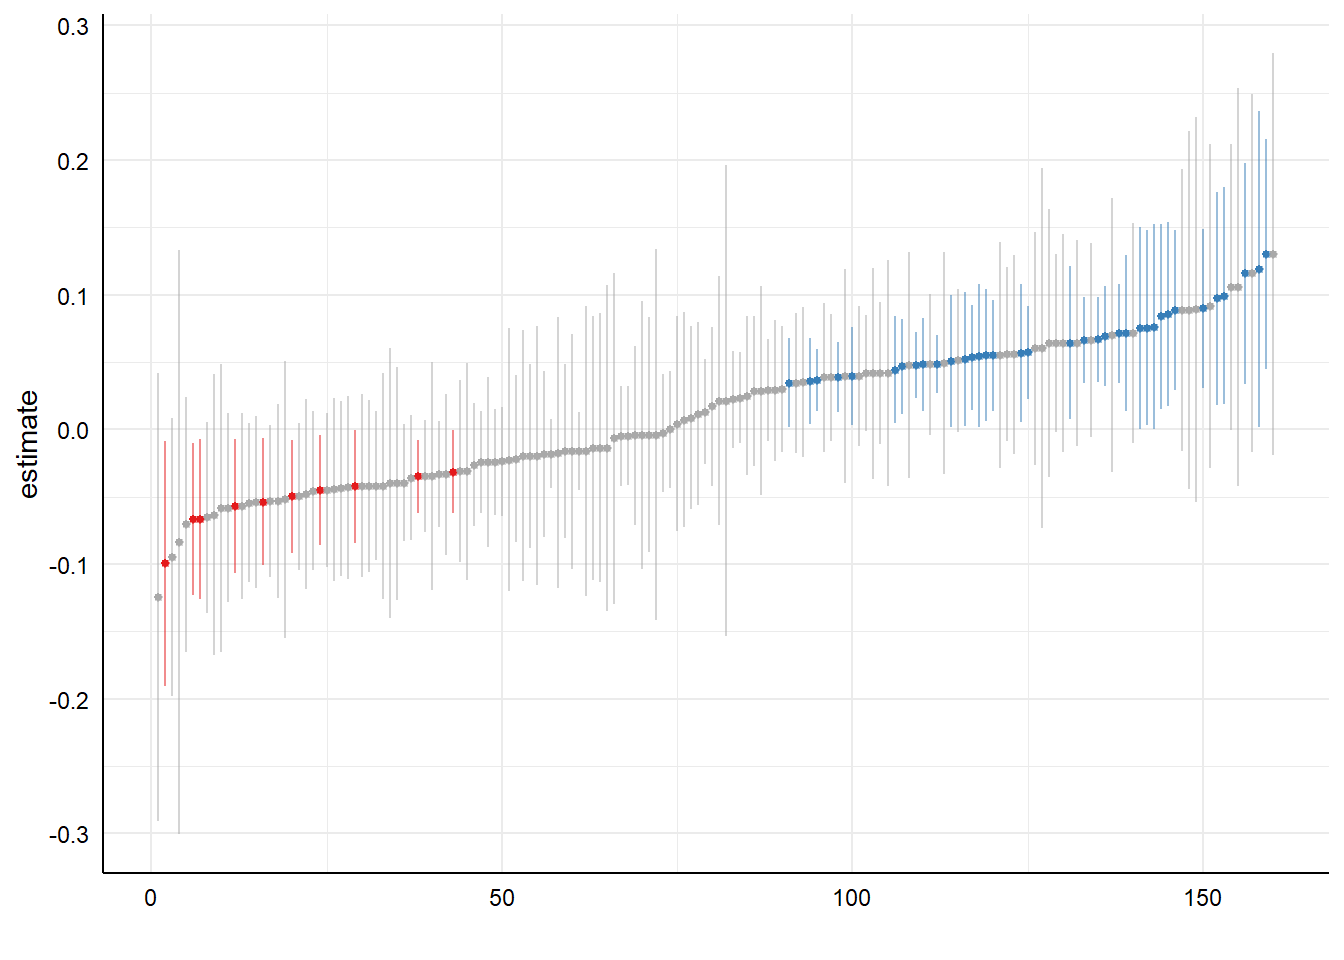
Figure I displays the specification curve, showing the 320 estimated effect sizes (and their confidence intervals) of the dummy variable measuring whether or not the respondent, or a family member, was injured or killed during World War II. Estimates are ordered from smallest to biggest, with statistically significant estimates at the 5% significance level highlighted in red (if negative) or blue (if positive). About 71% of these estimates are negative. A substantial part of the negative estimates is statistically significant (36.2% overall) but none of the positive estimates are statistically significant.
Overall, the median estimate is -0.04. Focusing on those specifications that use the 1-10 life satisfaction scale, the median estimate is -0.045, those using the 1-5 life satisfaction scale -0.029. These are small effect sizes when compared to the standard deviation of the 1-10 scale (2.13) or the 1-5 scale (1.09). And even the 5% percentile estimate (-0.12) and 95% percentile estimate (0.03) are small.
Figure I: A Specification Curve for the Impact of Being Injured/Having Injured or Killed Relatives during World War II on Life Satisfaction.
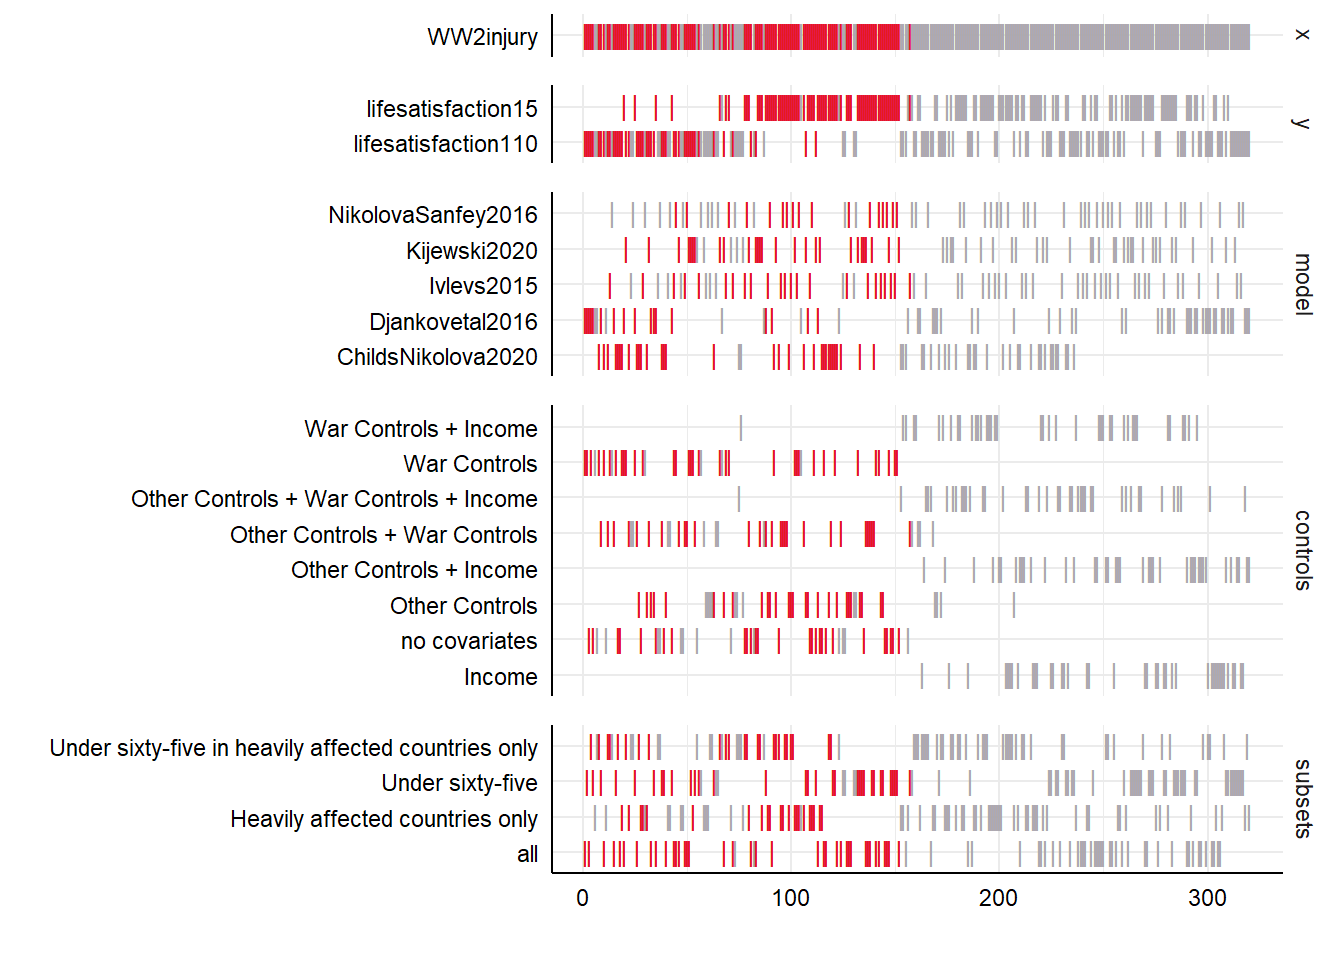
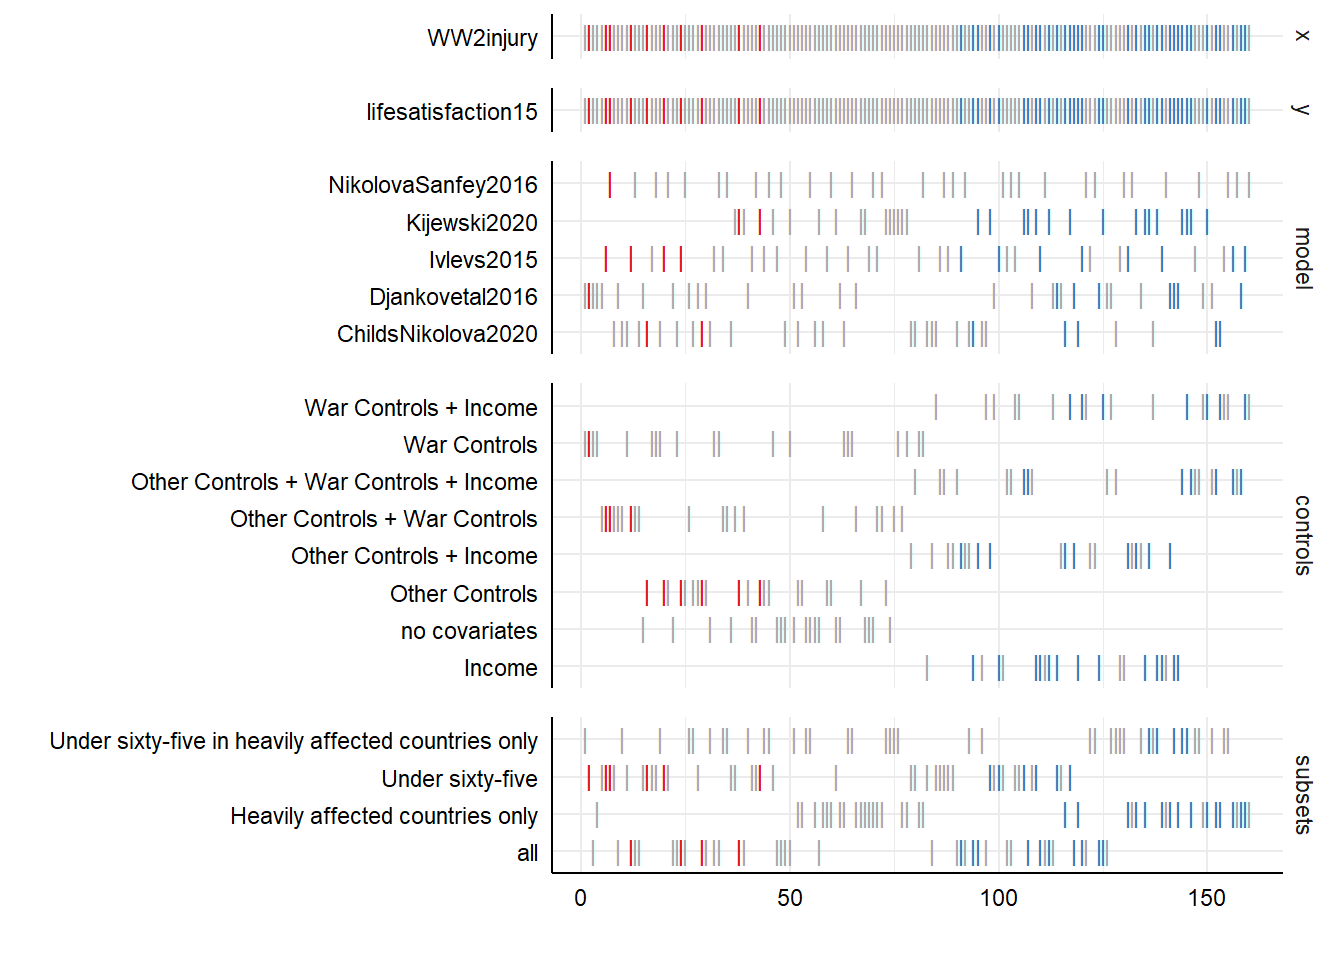
Figure II shows how estimates differ across models, control variables included, sample restrictions and dependent variables. The biggest difference comes from controlling for income. Omitting the income variables drives the estimated coefficient of the injured/killed war variable downwards and increases the likelihood the estimate is statistically significant. In fact, none of the estimated effects are statistically significant if income variables are included as controls. This is noteworthy as Kijewski (2020) is the only study that does not include an income variable as a control and is the only study that finds a significant negative effect of the injured/killed war variable. There are good reasons to include income as a control variable as happiness regressions typically include income, allowing for money to ‘buy’ happiness. At the same time, one could argue that income is a ‘bad’ control: if the war variable affects income, controlling for income will obscure some of the effect of the war on life satisfaction. That being said, all five papers included health as a control variable, and like for income one could argue that war experience affects current health status, and hence, that health should not be included as a control.
Figure II: What Affects the Estimated Effect Size of Being Injured/ Having Injured or Killed relatives during World War II.
Other factors matter much less. The regression of estimated effect sizes on the characteristics of the specifications in Table III shows that, keeping everything else constant, the model by Child and Nikolova (2020) has somewhat smaller effect sizes than the models by Djankov, Nikolova, and Zilinsky (2016), Ivlevs (2015), Kijewski (2020) and Nikolova and Sanfey (2016). Similarly, using the 1-10 life satisfaction scale results in somewhat smaller estimates, while differences in who is included in the sample do not seem to affect the effect sizes much.
Table III - Correlates of the Estimated Effect Size
=======================================================================================
                                                                Dependent variable:
                                                            ---------------------------
                                                                   Estimate Size
---------------------------------------------------------------------------------------
model - Djankovetal2016                                               0.013**
                                                                      (0.005)

model - Ivlevs2015                                                   0.019***
                                                                      (0.005)

model - Kijewski2020                                                 0.020***
                                                                      (0.005)

model - NikolovaSanfey2016                                           0.019***
                                                                      (0.005)

subset- Heavily affected countries only                               -0.002
                                                                      (0.005)

subset- Under sixty-five only                                         0.009*
                                                                      (0.005)

subset- Under sixty-five in heavily affected countries only          -0.011**
                                                                      (0.005)

Controls - No Additional Controls                                    -0.095***
                                                                      (0.007)

Controls - Other Controls                                            -0.077***
                                                                      (0.007)

Controls - Other Controls + Income Controls                            0.001
                                                                      (0.007)

Controls - Other Controls + War Controls                             -0.089***
                                                                      (0.007)

Controls - Other controls + War Controls + Income Controls           -0.017**
                                                                      (0.007)

Controls - War controls                                              -0.114***
                                                                      (0.007)

Controls - War Controls+Income Controls                              -0.020***
                                                                      (0.007)

Dependent Variable Life Satisfaction Scale 1 to 5                    0.021***
                                                                      (0.003)

Constant                                                              -0.013*
                                                                      (0.007)

---------------------------------------------------------------------------------------
Observations                                                            320
R2                                                                     0.706
Adjusted R2                                                            0.692
Residual Std. Error                                              0.031 (df = 304)
F Statistic                                                  48.684*** (df = 15; 304)
=======================================================================================
Note:                                                       *p<0.1; **p<0.05; ***p<0.01
IV. What about other war variables.
Until now we have focused on the impact of being injured or having injured or killed relatives during World War II. Now we will explore what affects the effect size of the variable that reflects whether the respondent’s family moved because of World War II.
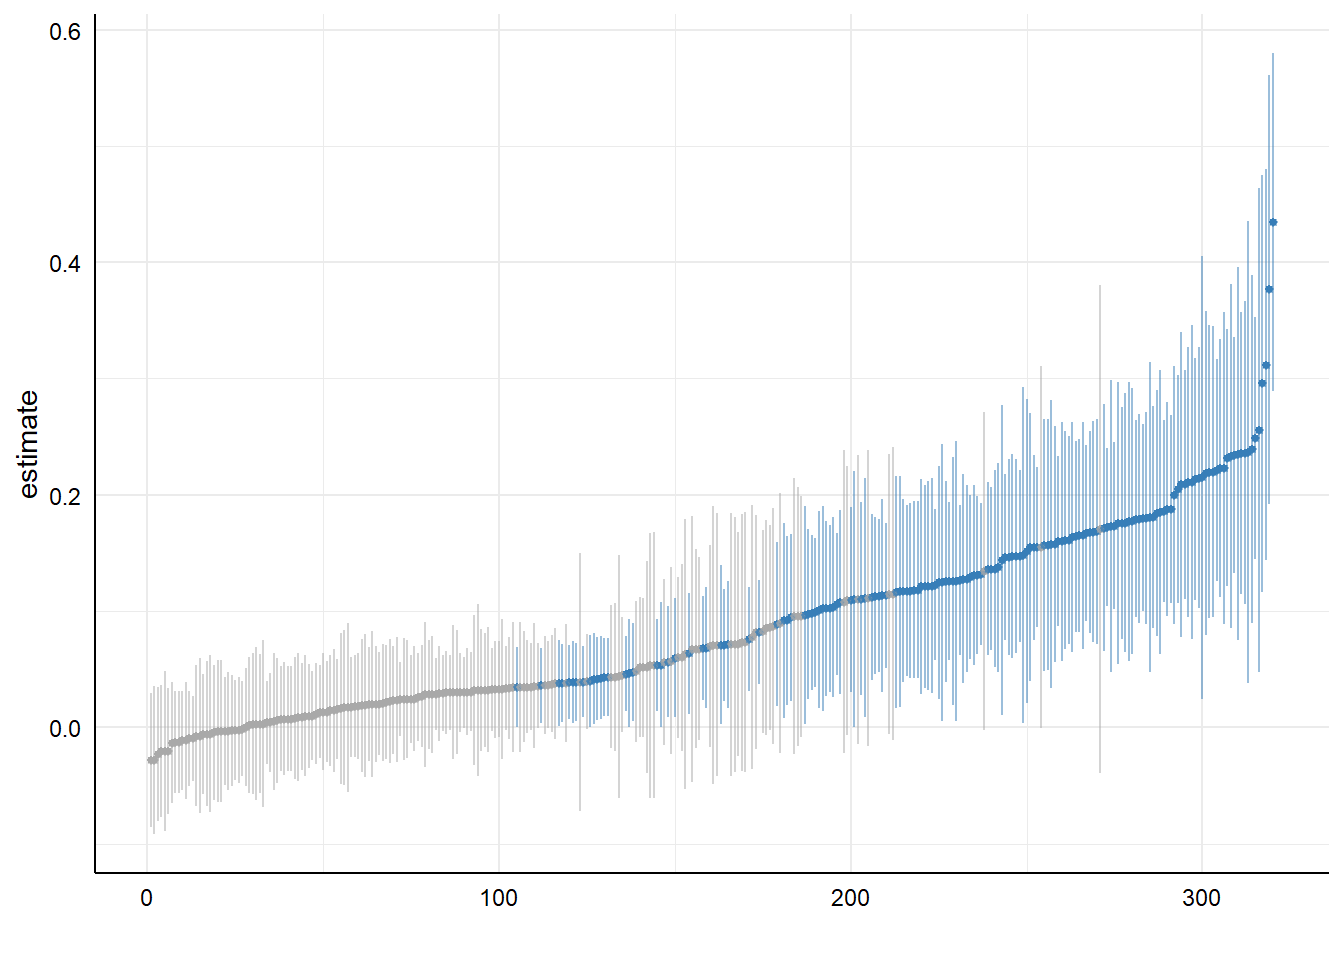
Interestingly, Figure III shows the effect of having moved to be mostly positive (92% positive, majority significantly so). The median of 0.07 is somewhat larger in absolute value than the median we found for the impact of being injured/killed, but still relatively small when compared to scale or standard deviation in the life satisfaction variable (2.13 for the 1-10 scale and 1.09 for the 1-5 scale).
Figure III: A Specification Curve for the Impact of Having Moved Because of World War II on Life Satisfaction.
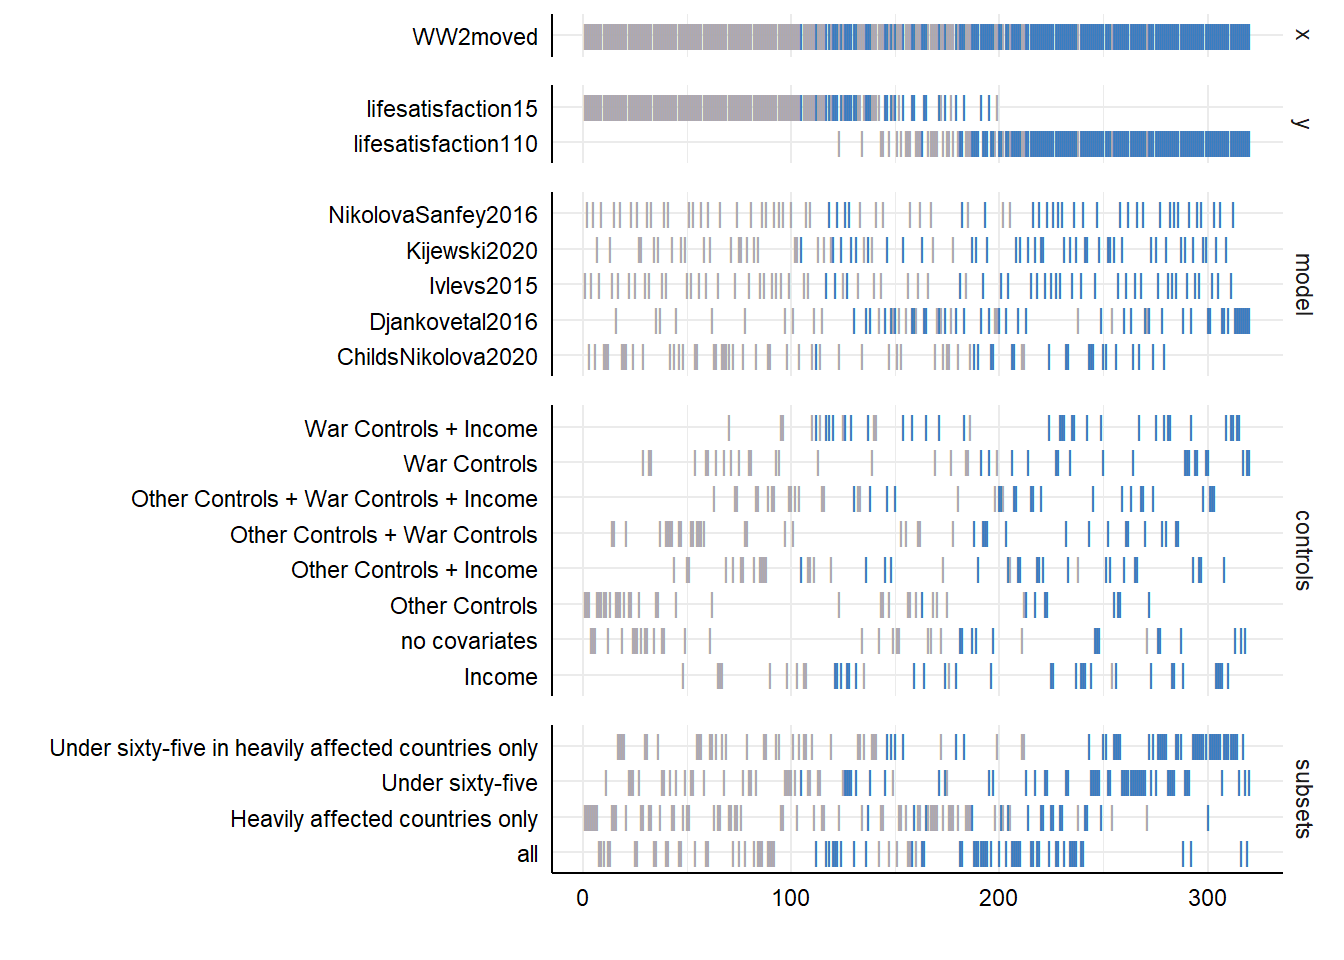
Here again we find one factor that crucially affects conclusions: models using the 1-5 life satisfaction scale produce much smaller and less often significant effects, while most specifications using the 1-10 life satisfaction scale find a positive and significant effect.
Figure IV: What Affects the Estimated Effect Size of Having Moved Because of World War II on Life Satisfaction.
Finally, we also explored the specification curves for the three recent war variables: whether one was injured in a recent conflict, whether one moved because of a recent conflict and whether one has family members injured or killed because of a recent conflict. The effect size of these variables varied a lot but few specifications showed significant effects.
V. Replicating using the more recent LITS III data.
So far, we worked with data from the second wave of the Life in Transition Survey. In 2016, a third wave was implemented. In this section, we analyse whether the conclusions of the original studies are upheld when the more recent data are used.
The advantage of using the third wave is that the sample is bigger, with about 1500 respondents per country being interviewed, compared to about 1000 in the second wave. While most control variables used by the original studies are also available in the third wave, there are some exceptions. Most importantly, only one life satisfaction question, the one with the scale of 1 to 5, got asked in the third wave.
Table IV compares the results of the original studies with the replicated results using the data from LITSIII. Interestingly, the replication results with the new data are similar to the results obtained by the original studies. Using Kijewski (2020) ’s methodology, we find a negative and significant effect, using Ivlevs (2015) ’s methodology, we find a positive and significant effect while the other studies produce no significant effect. This suggest that if the original authors had done their studies later, using LITSIII rather than LITSII, they would have obtained similar conclusions in terms of the long-term impact of war on life satisfaction.
| Table IV: Replicating the Literature with 2016 data |
|
Effect Size |
P value |
Sample Size |
Replication Effect Size |
Replication P value |
Replication Sample Size |
| Kijewski 2020 |
-0.108 |
p<0.01 |
25618 |
-0.027 |
p<0.1 |
29067 |
|---|
| Childs and Nikolova 2020 |
-0.006 |
p>0.1 |
9538 |
0.049 |
p>0.1 |
13194 |
|---|
| Ivlevs 2015 |
0.071 |
p<0.05 |
24070 |
0.041 |
p<0.05 |
24061 |
|---|
| Nikolova and Sanfey 2016 |
0.0241 |
p>0.1 |
25666 |
0.01 |
p>0.1 |
30180 |
|---|
| Djankov et al. 2016 |
-0.008 |
p>0.1 |
24836 |
-0.012 |
p>0.1 |
30180 |
|---|
VI. A Specification Curve Analysis using the more recent data.
For completeness, our final step is to perform a specification curve analysis with the more recent data from LITSIII.
As Figure V shows, we again find a wide range of results depending on the specification choices we make. Interestingly, compared to Figure I which mainly showed negative effects, using the third wave leads to many more positive effects.
Figure V: A Specification Curve for the Impact of Being Injured/ Having Injored or Killed Relatives during World War II on Life Satisfaction, LITSIII.
Interestingly, the income variables are again crucially important for the conclusions (see Figure VI). Like in Figure II including income increases the estimated impact of the war variable. While in Figure I this increase turned significantly negative estimates into insignificant estimates, when using LITSIII, the increase one gets by including income variables tends to push the estimated effect of the war variable from insignificant to significantly positive.
Figure VI: What Affects the Estimated Effect Size of Being Injured/Having Injured or Killed Relatives during World War II, LITSIII.
VII. Conclusions.
In this paper, we replicate the literature that uses the second wave of the Life in Transition Survey to estimate the impact of World War II on life satisfaction, conduct a specification curve analysis, and update the literature by also using data from the third wave of the survey. While war experience is not fully randomized, limiting causal claims one can make about its impact, the LITS II survey is a great source of observational data to investigate the long-run relationship between war and life satisfaction given it asks a large sample of respondents about various war experiences, and measures life satisfactions in multiple ways.
Given the suitability of the survey, it is no surprise that the published literature using LITS II to regress life satisfaction on war experience ( Kijewski (2020), Child and Nikolova (2020), Ivlevs (2015), Nikolova and Sanfey (2016), Djankov, Nikolova, and Zilinsky (2016)) is sizable. More surprising is that, depending on the paper one reads, one can find a significant negative effect, a significant positive effect or insignificant effects of World War II experience on life satisfaction, despite these studies all using the same dataset and similar measures of life satisfaction and war experience.
In this paper, we explore the reasons for this heterogeneity in findings. Directly replicating the five papers using the LITS II data, we find effect sizes and statistical significance that are similar to those published. And even when using the more recent LITS III (2016 vs. 2010) to update these five papers we come to similar conclusions as the original authors.
However, a specification curve analysis finds that, based on 320 ‘reasonable’ specifications and the LITS II data, the impact of being injured/having a family member being injured or killed during World War II is mainly estimated to be negative but that these estimates are statistically significant only when not including income as a control variable. A specification curve analysis, based on 320 ‘reasonable’ specifications and the LITS III data, similarly shows the importance of the including income variables but shows that the impact of being injured/having a family member being injured or killed during World War II is mainly estimated to be positive but that these estimates are statistically significant only when including income as a control variable.
We further show that the impact of having moved because of World War II is mainly estimated to have a positive effect but only so when measuring life satisfaction on a 1-10 scale (rather than a 1-5 scale). Finally, we find little support for a significant effect of recent war experience on life satisfaction.
Overall, this study shows that there is no easy answer to the question whether experiencing a war has a long-term impact on life satisfaction. The assumptions one chooses to make in terms of control variables, measurement of life satisfaction and war experience, whether to weigh observations or cluster standard errors, affect whether one obtains a negative, positive, significant or insignificant estimate. Moreover, the vast majority of specifications suggest the estimated impact is minor when compared to the overall variation in life satisfaction. Hence, using the Bradford-Hill criteria (Bradford-Hill (1965)), we would argue that research about the long-term impact of war based on LITS data shows low consistency and low strength, and thus provides little support for there being a causal long-term effect of war experience on life satisfaction.
This paper further adds to the literature that shows that the choices researchers make when analysing a dataset can have a major impact on the conclusions they draw. It is also a warning to readers that single papers, even when including several robustness checks, do not necessarily represent what one would learn from a comprehensive analysis from the same dataset. The analysis here thus suggests a specification curve analysis should be a part of any empirical paper, especially now that software packages are available which make running hundreds of specifications straightforward. Rather than focusing on robustness checks that confirm the main finding of a paper, authors should focus on revealing the true extent of model uncertainty.
References
Adsera, Alıcia‘and Francesca Dalla Pozza, Sergei Guriev, Lukas Kleine-Rueschkamp, and Elena Nikolova. 2020. “Height and Well-Being During the Transition from Plan to Market.” Economic Policy January 2021, 77–120.
Baker, Monya. 2016. “1,500 Scientists Lift the Lid on Reproducibility.” Nature, 533(7604), 452-454.
Bradford-Hill, Austin. 1965.
“The Environment and Disease: Association or Causation?” Proceedings of the Royal Society of Medicine, 58 , 295-300.
https://www.edwardtufte.com/tufte/hill.
Child, Travers Barclay, and Elena Nikolova. 2020.
“War and Social Attitudes.” Conflict Management and Peace Science, Vol. 37(2), 152–171.
https://journals.sagepub.com/doi/abs/10.1177/0738894217750564.
Coupé, Tom, and Maksym Obrizan. 2023. “War and Happiness.” Handbook of Subjective Well-Being.
Djankov, Simeon, Elena Nikolova, and Jan Zilinsky. 2016.
“The Happinessgap in Eastern Europe.” Journal of Comparative Economics, Vol. 44, 108–124.
https://www.sciencedirect.com/science/article/abs/pii/S0147596715000888.
Hlavac, Marek. 2022. “Stargazer: Well-Formatted Regression and Summary Statistics Tables. R Package Version 5.2.3.” Https://CRAN.R-Project.org/Package=stargazer.
Hoogeveen, Suzanne, Alexandra Sarafoglou, Balazs Aczel, Yonathan Aditya, Alexandra J. Alayan, Peter J. Allen, Yulmaida Amir Sacha Altay Shilaan Alzahawi, and Eric-Jan Wagenmakers. 2021. “A Many-Analysts Approach to the Relation Between Religiosity and Well-Being.” Religion, Brain & Behavior, 13(3), 237-283.
Huntington-Klein, Nicholas, Arenas A., Beam E., Bertoni M., J. Bloem, Burli P., Chen N., et al. 2021. “The Influence of Hidden Re-Searcher Decisions in Applied Microeconomics.” Economic Inquiry, 59(3), 944-960.
Ivlevs, Artjoms. 2015. “Happy Moves? Assessing the Link Between Life Satisfaction and Emigration Intentions.” Kyklos, Vol. 68(3), 335–356.
Kijewski, Sara. 2020.
“Life Satisfaction Sixty Years After World War II: The Lasting Impact of War Across Generations.” Applied Research in Quality of Life, Vol. 15, 1253–1284.
https://link.springer.com/article/10.1007/s11482-019-09726-z.
Masur, Philipp K., and Michael Scharkow. 2020.
“Specr: Conducting and Visualizing Specification Curve Analyses (Version 1.0.1).” https://CRAN.R-project.org/package=specr.
Nikolova, Elena, and Peter Sanfey. 2016.
“How Much Should We Trust Life Satisfaction Data? Evidence from the Life in Transition Survey.” Journal of Comparative Economics, Vol. 44, 720–731.
https://www.sciencedirect.com/science/article/abs/pii/S0147596715001122.
Obrizan, Maksym. 2019. “Violent Conflict and Unhappiness: Evidence from the 2016 ‘Life in Transition’ III Survey.” Economics Bulletin, Vol.39(1), 192-199.
Recher, Vedran. 2022. “History Matters: Life Satisfaction in Transition Countries.” Journal of Happiness Studies 23, 171–193.
Reed, W. Robert. 2018. “A Primer on the ‘Reproducibility Crisis’ and Ways to Fix It.” Australian Economic Review, 51(2), 286-300.
Simonsohn, Uri, Simmons Joseph, and Leif Nelson. 2021. “Specification Curve Analysis.” Nature Human Behavior 4, 1208–1214.
Steegen, Sara, Francis Tuerlinckx, Andrew Gelman, and Wolf Vanpaemel. 2016. “Increasing Transparency Through a Multiverse Analysis.” Perspectives on Psychological Science, 11(5) 702–712.